

Divergences can tell you a LOT as a trader. Right now, a key split is showing up in the stock market – and I don’t want you to miss it!
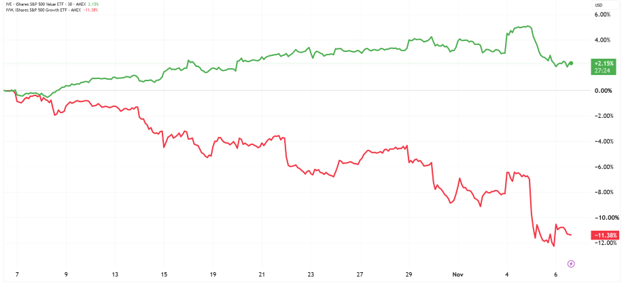
Take a look at the MoneyShow Chart of the Day, which shows the performance of two ETFs in the last month – the iShares S&P 500 Value ETF (IVE) and the iShares S&P 500 Growth ETF (IVW). Highlighted recently by MoneyShow contributor Jim Woods, the widening divergence is something you should watch in the remainder of 2026 (and beyond!)
IVE (Green), IVW (Red) - 1-Mo. % Change
Source: TradingView
We’re not talking about a small performance gap here. It’s like a set of alligator jaws on the chart! The value ETF is UP 2.1% in the last month, while the growth ETF is DOWN 11.2%.
When you look at the top 10 holdings of the two ETFs, it’s easy to see why. IVE does have a couple of Big Tech names like Apple Inc. (AAPL) and Amazon.com Inc. (AMZN) on its list. But the others are stocks like ExxonMobil Holdings Corp. (XOM), Procter & Gamble Co. (PG), and Walmart Inc. (WMT)
As for IVW? Its top holding is Nvidia Corp. (NVDA). In addition to AAPL and AMZN, it also features stocks like Microsoft Corp. (MSFT), Broadcom Inc. (AVGO), and Meta Platforms Inc. (META). Yep, that’s a rogue’s gallery of AI and chip stocks in the midst of an AI and chip stock meltdown.
Is it just a short-term move? Or the start of something longer-lasting? That’s the critical question.
But it’s a big enough swing to leave value handily outperforming growth year-to-date, as well as over the past 12 months.
Even on a FIVE-year basis, IVE is now only underperforming IVW by five percentage points. That’s some serious food for thought – especially IF you’re overloaded on tech relative to other sectors.