The Democrat victory in the midterm elections sent shock waves across equity markets recently. So, when can the current pullback be expected to end? Here’s my take, writes Tom Essaye, president of the Sevens Report.
Last Thursday's decline marked the worst day for the major indices since April 2025, as the S&P 500 Index (^SPX) posted a 2.7% weekly loss, while the Nasdaq Composite dropped by 4.9%. Selling intensity was strong but fell short of the levels of panic often observed near market lows. Some market segments even posted weekly gains, such as consumer staples and real estate.
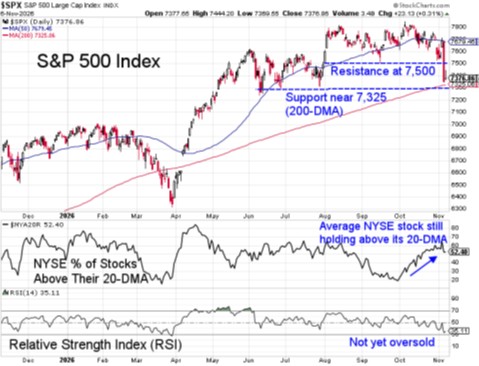
Despite the S&P 500 trading decisively below both its 50- and 20-DMAs, the percentage of all NYSE stocks above their averages is holding up, even with last Thursday's selloff. This shows that stocks are holding up reasonably well outside of heavily weighted mega-caps within the major indices. With pockets of bullishness outside of mega-caps, the potential magnitude of further near-term losses in the major indices could be reduced.
During volatile markets, it's especially critical to analyze the daily forces of supply and demand. Thursday's selloff, as mentioned above, failed to reach the level of intensity associated with investor capitulation. Down volume was just 84% of the total (rather than 90% or more).
This suggests that supply may not have been exhausted quite yet, as the most significant market bottoms usually have investors willing to sell quality stocks at "any" price. But given our still-bullish long-term outlook, we recommend using a combination of indicators over multiple time frames to help identify high-probability bottoms and associated buying opportunities.