
In order to stay in harmony with the U.S. market it’s useful to follow the hourly S&P 500 (SPY) to see the continuation or a potential short term change in trend.
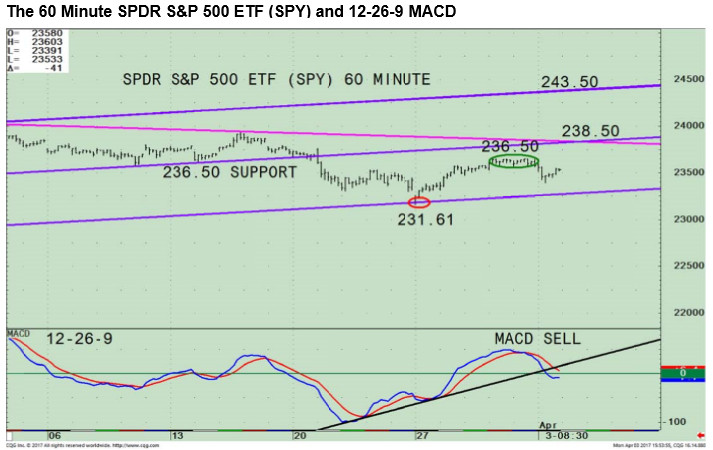
The top portion shows the 60 minute S&P 500 (SPY) active trading channel (purple lines). The SPY opened slightly higher at the opening but fizzled quickly. The SPY remains in a narrow trading range. Resistance is at 236.50 (green circle) followed by 238.50.
A break above 238.50, the middle channel and downtrend line would be bullish. If the breakout occurs, then the odds would increase a rally towards 243.50 is possible. A break below the lows at 231.61 would be bearish for the near term. Until the trading range is violated in one direction or another I give the benefit of the doubt to the bulls.
The lower portion of the chart is the 12-26-9 MACD, a momentum indicator. MACD gave a sell and has broken the uptrend giving a warning more weakness is possible in the near term.
However, MACD is oversold, below 0, so an immediate turn up now, would be a sign there will be another rally attempt towards 238.50 (the middle channel).
Subscribe to Signalert Asset Management's Systems & Forecasts here…


