Moneyshow’s Tom Aspray takes a look at one of the year’s top performing sectors that has broken out of a long-term trading range and this has important implications for the coming year.
The inability of Speaker Boehner to even get the support of his own party Thursday night triggered a sharp plunge in the stock index futures. In one hour, the March E-Mini S&P 500 futures dropped from 1436.50 to a low of 1391.25, but finished the hour at 1421.
At the lows, the futures were down over 3% as they barely held above the early December lows at 1390.50. It is likely that many stops were hit and quite a few traders are waking up to the grim news that they were stopped out well below where the market is likely to open Friday. Clearly there will be more selling on the open, but it would take a close under the early December lows to weaken the technical outlook.
Even though we head towards 2013 with a high degree of short-term uncertainty the technical action suggests that this correction should be an opportunity to stuff your stocking with stocks. There is one sector whose long-term charts make it a likely market leader again in 2013, and one stock looks quite attractive on a pullback to year-long support.
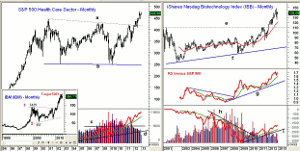
Chart Analysis: The monthly chart of the S&P 500 Health Care sector shows that the trading range, going back to 2000 (lines a and b) was completed in March as the resistance at 420 was overcome.
- The trading range is 130 points wide so the upside targets from the formation is in the 550 area.
- The monthly analysis can generate some very strong signals and the monthly chart of International Business Machines (IBM) is a good example.
- In 2010, IBM completed a ten-year flag formation, lines 1 and 2, as it broke out of its trading range of $129 to $57.
- The upside target from the formation at $201 was exceeded in March 2012 as IBM’s high this year is $211.79.
- This means that health care could stay strong until 2014.
- The monthly on-balance volume (OBV) broke through major resistance, line c, in 2010 as it was leading prices higher.
- The OBV continues to act strong and the weekly OBV (not shown) did confirm the recent highs.
- There is first good support in the 445-455 area.
The iShares Nasdaq Biotechnology Index (IBB) is up 33.2%, so far in 2012, and its monthly chart shows that it overcame major resistance, line e, last January.
- The trading range for IBB ($109.35 to $39.65) has upside targets now in the $178 area.
- The relative performance broke its downtrend in June 2008 and shows a strong long-term uptrend, line g.
- The RS line did confirm the recent highs and is well above its rising WMA.
- The weekly OBV broke its four-year downtrend, line h, in 2010.
- The OBV is below the early 2000 highs but shows a strong uptrend, line I, from the 2009 lows.
- The weekly OBV and RS lines (not shown) are positive and also confirmed the lows.
- IBB is holding the quarterly pivot at $139.08 with next weekly support at $134.47. Using current data the 1st quarter pivot for 2013 is at $137.75.
NEXT PAGE: Top Stock in Top-Performing Sector
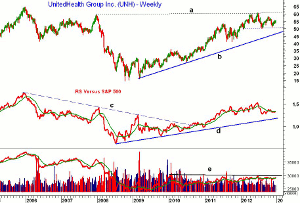
|pagebreak|UnitedHealth Group Inc. (UNH) is a $56.65 billion operator of health care plans that current yields 1.6%. UNH made a high in June at $60.75, which was just above the 2007 high of $59.46.
- This area represents important long-term resistance, line a. An upside breakout would have initial upside targets at $73-$75.
- The weekly relative performance broke its four+ year downtrend, line c, in 2010 signaling that it was starting to outperform the S&P 500.
- The relative performance did confirm the June highs and is now just below its WMA.
- The RS line is holding above the 2011 lows and is well above long-term support at line b.
- The weekly OBV is above its WMA but still below long-term resistance at line e.
- The monthly OBV (not shown) is acting much stronger as it has made higher highs over the past three years.
- UNH has moved above its quarterly pivot at $54.84 in the past week with further support in the $53-$53.60 area.
What it Means: The health care sector is one of my Best Sector Bets for the New Year and the long-term monthly chart provides more evidence of its potential for 2013. There are likely to be sharp setbacks along the way. For example, in the summer of 2011, IBM corrected from $185 to $157 in just four weeks.
The Select Sector SPDR Health Care (XLV) is part of the Charts in Play Portfolio, and I would look to get back in iShares Nasdaq Biotechnology Index (IBB) on a correction. The strong yearly support for UnitedHealth Group Inc. (UNH) also makes it a good candidate at lower levels.
How to Profit: For iShares Nasdaq Biotechnology Index (IBB), go 50% long at $132.12 and 50% long at $128.90, with a stop at $124.38 (risk of approx. 4.7%).
For UnitedHealth Group Inc. (UNH), go 50% long at $53.78 and 50% long at $52.46, with a stop at $49.58 (risk of approx. 6.6%),


