
Most analysts are not convinced that these three lagging ETFs are ready to catch up with the major averages but MoneyShow's Tom Aspray uses technical analysis to explain how they could be market leaders by the end of the year.
The stock market took a rest on Monday, despite a 4.9% increase in existing home sales, as volatility was low, with the advance/decline ratios neutral. The preliminary Euro zone manufacturing index came in weaker than expected as France's data dragged the zone lower. In contrast, HSBC initial reading from the purchasing managers index for China hit a seven month high as it moved back into the expansion zone.
More data today on manufacturing with the Richmond Fed Manufacturing Index, while the Durable Goods and GDP will be released Wednesday. The focus today will be on the housing market, with the S&P Case-Shiller Housing Price Index and New Home Sales out this morning.
The Conference Board will also release the June reading for Consumer Confidence, which was flat last month. This data could be important for three of the sector/industry ETFs that have been lagging the broader market all year. If the economy is going to improve further, then we should see more consumer buying and an improving level of confidence.
While the Spyder Trust (SPY) dropped into negative territory for the year in mid-April, it is now up 6.53% YTD according to Morningstar. In contrast, the Sector Select SPDR Consumer Discretionary (XLY) is down 0.69% with the SPDR S&P Retail ETF (XRT) down 1.85%. Both are up nicely from their May lows but are still below their 2014 highs.
The housing market also plays an important economic role as most of the home building stocks peaked over a year ago and most analysts are not yet convinced it is ready to rebound, as the iShares Dow Jones Home Construction ETF (ITB) is down 2.55% YTD. The relatively low level of buy recommendations for the homebuilding stocks also gives them significant upside potential (Why Following the Crowd Can Be a Bad Idea) and one individual homebuilder is also acting well technically.
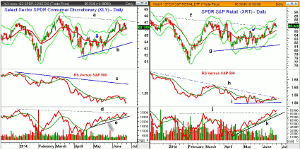
Click to Enlarge
Chart Analysis: The Select SPDR Consumer Discretionary (XLY) peaked on June 9 at $67.05, which was just below the March high of $67.42.
- XLY again tested the monthly projected pivot resistance at $66.50 last week with quarterly resistance at $70.97.
- A weekly close above $67.42 would complete the continuation pattern with upside targets in the $74-$75 area.
- One Monday, the 20-day EMA was tested with the starc- band at $65.01.
- The monthly and quarterly pivots are at $64.46 and $64.19, respectively.
- XLY was recommended on May 6 (see arrow) as XLY subsequently dropped to a low of $62.43.
- The daily relative performance made a new low last week as it is still lagging the S&P 500.
- The RS line needs to move above the early June highs and the long-term downtrend, line c, to signal it is a market leader.
- The daily on-balance volume (OBV) is acting much stronger as it moved to new highs for the year (line d) last week.
- The OBV shows a solid uptrend, line e.
The SPDR S&P Retail (XRT) broke through its resistance, line f, last week but is still just below the March high of $78.15. It does appear to have broken out of its weekly flag formation.
- In November of 2013, XRT made a high of $88.42 with monthly projected pivot resistance at $88.56.
- The quarterly resistance is at $89.11 with the weekly starc+ band at $89.94.
- The rising 20-day EMA was tested on the recent market pullback as the daily chart shows a clear uptrend.
- The relative performance does appear to be bottoming, line i.
- A strong move above its downtrend (line h) and the recent high will signal that it is a market leader.
- The daily made convincing new highs last week as it overcame resistance at line j.
- The OBV is acting stronger than prices and the weekly (not shown) is also positive.
- The quarterly pivot at $84.92 represents first support with stronger in the $82.50-$83 area.
- XRT was recommended on May 13 (see arrow) and was filled at an average price of $84.01.
NEXT PAGE: Another ETF and a Holding to Watch
|pagebreak|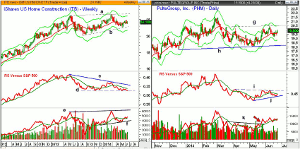
Click to Enlarge
The iShares Dow Jones Home Construction ETF (ITB) has an expense ratio of 0.46% with 33 stocks. Lennar Corp. (LEN) at 10.2% and DR Horton (DHI) at 9.75% are two of the largest holdings.
- The weekly chart shows a broad trading range (lines a and b), which I interpret as a continuation pattern not a double top.
- The monthly projected pivot resistance is at $24.77 with the June high at $24.94.
- The weekly starc+ band is at $26.054 and a weekly close above $26.52 is needed for a major upside breakout.
- The weekly relative performance still shows a pattern of lower highs, line c.
- The RS line is now testing important support at line d.
- The weekly OBV shows a pattern of higher lows, line f, and turned up from its WMA last week.
- The OBV made new highs in February (line e) as it has been stronger than prices.
- The monthly pivot is at $23.67, which is first good support with the quarterly projected pivot support at $22.77.
PulteGroup, Inc. (PHM) is a 9.72% holding in ITB and it made a high on June 9 at $20.42 (line g), which is also the monthly projected pivot resistance.
- On a close above this level, the next resistance from late February and early March is in the $21.30-$21.54 area.
- The weekly starc+ band is at $21.84 with the quarterly projected pivot resistance at $23.02.
- The relative performance shows a pattern of higher lows (line j) but it needs to move above the resistance at line i, to complete its bottom.
- The daily OBV broke through the resistance (line k) in May and is in a shallow uptrend.
- The weekly OBV (not shown) is above its rising WMA and positive.
- The monthly pivot at $19.19 represents first good support with additional in the $18.80-$18.90 area.
What it Means: In early June's 4 of the Year's Best Sector ETFs, I took a look at four of the best performing sector ETFs in 2014. The three ETFs in today's column are way down on the performance list, so far, in 2014.
I would not be surprised to see one, or all of them, nearer the top of the list by the end of the year. They require a sharper rally and heavier volume to confirm upside breakouts on the weekly charts.
I would look to buy iShares Dow Jones Home Construction ETF (ITB) on a buy stop above the market and PulteGroup, Inc. (PHM) near current levels.
How to Profit: For iShares Dow Jones Home Construction ETF (ITB) go 50% long on a buy stop at $25.07 with a sell stop at $23.73 (risk of approx. 5.3%).
For PulteGroup, Inc. (PHM) go 50% long at $19.77 and 50% at $19.42 with a stop at $18.79 (risk of approx. 4.1%).
Portfolio Update: Should be 50% long the SPDR S&P Retail (XRT) at $84.44 and 50% at $83.58, use a stop at $82.19.
Should be 100% long the Select SPDR Consumer Discretionary (XLY) at $63.92, with a stop now at $62.76.


