Even though the stock market received an additional boost after Thursday’s ECB meeting, MoneyShow’s Tom Aspray takes a technical look at the three key Dow Averages to see if there’s also more risk for the market at current levels.
The comments by Mario Draghi of the ECB promising further stimulus gave the stock market an additional boost with the 37th record close by the S&P 500 this year. The market internals were just slightly positive again as 1813 stocks advanced versus 1349 declining.
The NYSE Composite continues to lag as Thursday’s close at 10,843 was just below the October 31 close and still well below the July 3 record close of 11,104. The McClellan oscillator has been flat for the past few days and is still well below last month’s high.
The Dow Jones Utility Average was the big loser, down 1.84% on the day. A technical look at the three key Dow Averages sends a key message to investors but there are also some cautionary notes that should not be ignored.
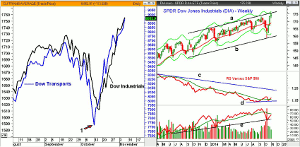
Chart Analysis: The daily close chart of the Dow Transports (in blue) and the Dow Industrials (in black) illustrates that they both made further new closing highs on Thursday.
- This keeps the positive Dow Theory signals intact as the last time the two averages diverged in a meaningful way was in 2012.
- The Dow Transports bottomed on October 13 (point 1), which was three days before the Dow Industrials made their daily closing low.
- As I have mentioned many times previously, the leading action of the Transports has been a bullish sign for the economy.
- Over the past month, the DJ Airlines Index has gained 22.5% as the sharp one day drop over the Ebola fears was a buying opportunity.
- The weak technical outlook for crude oil is still clearly a plus for the Transports.
- For the Industrials, the quarterly pivot is at 16,909 and is at 8375 for the Dow Transports.
The SPDR Dow Jones Industrials (DIA) is currently trading just above last week’s highs with the weekly starc+ band at 17,666.
- The upper boundary of the trading channel, line a, is now being tested.
- The quarterly projected pivot resistance is at 17,925.
- The first support is at 17,350, which was the September high.
- The 20-week EMA is at 16,890, which is now far below the quarterly pivot of 16,909.
- The weekly relative performance has moved back above its WMA and appears to be forming a bottom, line d.
- A move in the RS line above the October highs will signal the Dow is leading the S&P 500.
- The weekly OBV has turned up from support at line e, but is still well below its slightly declining WMA.
- The daily OBV (not shown) is also still well below its previous high.
NEXT PAGE: Two More Dow Averages to Watch
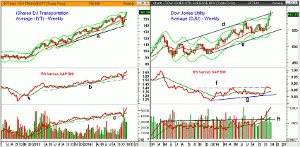
|pagebreak|The iShares DJ Transportation (IYT) dropped below its starc- band for two weeks in October as the support at line a, was briefly violated.
- The weekly starc+ band at $160.16 has been tested this week.
- The quarterly projected pivot resistance is at $163.88.
- The relative performance has confirmed the new highs after testing its long-term uptrend, line b, last month.
- The RS line has signaled that this was a market leading sector since late 2013.
- The weekly on-balance volume (OBV) also briefly violated the support (line b) going back to the June 2013 lows last month.
- The OBV made significant new highs this week.
- There is short-term support now at $156-$157.60 with the rising 20-day EMA at $153.47.
- The quarterly pivot is significantly lower at $150.46.
The Dow Jones Utility Average (DJU) spiked above the weekly starc+ band Wednesday and early Thursday before closing lower.
- The weekly resistance at line d and the quarterly projected pivot resistance at 601.04 were also exceeded.
- The monthly projected pivot resistance for November is at 632.57.
- The first band of chart support is in the 575-585 area with the 20-day EMA at 583.
- The weekly RS line has just slightly exceeded its resistance at line f, but may turn down this week.
- The daily relative performance (not shown) dropped below its WMA with Thursday’s lower close.
- It is still well above its WMA and support at line g.
- The weekly OBV moved slightly above its resistance (line h) in August and then broke out impressively in September.
What it Means: The weekly and monthly analysis of all three Dow Averages is positive but the Transports and Utilities have reached high risk buy levels. The Sector Select SPDR Utilities (XLU) is up almost 15% in the past three months and that is an impressive gain for any sector. Additionally, the XLU is 4.3% above its 20-day EMA with the EMA Osc at its highest level since late 2009.
The failure of the weekly and daily on-balance volume (OBV) to confirm the new highs for the SPDR Dow Jones Industrials (DIA) is also a concern. This increases the risk for the market at current levels.
How to Profit: No new recommendation.


