
The IBD Top 50 list is another good place to find stocks for your watch list, so MoneyShow’s Tom Aspray takes to the charts to see if any of the stocks that moved up from the bottom of this list over the last three weeks look promising.
It took new stimulus comments from the ECB’s Mario Draghi to nudge some US stocks to a bit higher close Monday but it clearly was mixed. The A/D ratios were slightly negative as only the Dow Jones Utilities and Philadelphia Gold/Silver Index managed gains of over 1%.
Though the short-term momentum and A/D indicators have continued to deteriorate, until prices break near term support in the $200 area for the Spyder Trust (SPY), more range bound trading seems likely.
Some stocks that are not buyout candidates have continued to make higher highs in the current market environment. If stocks are again able to trend higher, whether it is after a correction or a powerful breakout from the recent trading range, some of these stocks are likely to be new leaders.
Many are likely familiar with the IBD Top 50 list, which is a “weekly computer generated watch list of market leading growth stocks.” I have often wondered if one can find new trading opportunities by tracking those stocks that move up from the bottom of the list.
In comparing the Top 50 list from October 27 to that from last Friday, I noted that Valeant Pharmaceuticals (VRX) had moved from last on the list to number 30 in just 15 days. During this period, the stock has gained just over 6%, and on Monday, closed at a new six month high on three times the average volume.
Was this significant or just the market’s reaction to the buyout of Allergan (AGN) by Actavis (ACT) for much more than Valeant was willing to pay? Do any of the other stocks that have moved up the IBD Top 50 list in the past three weeks look like new market leaders?
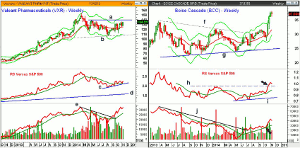
Click to Enlarge
Chart Analysis: Valeant Pharmaceuticals (VRX) is a $45.9 billion specialty pharmaceutical and medical device company that closed Monday 2.5% above last week’s close.
- VRX is still below the weekly resistance, line a, in the $139 area.
- The quarterly projected pivot resistance is at $140.05 with the weekly starc+ band at $144.60.
- In February 2014, VRX had a high of $153.10.
- The weekly relative performance moved above its WMA in September.
- The RS line is in a clear uptrend after just testing its WMA.
- The weekly on-balance volume (OBV) is acting stronger as it tested its all time high just two weeks ago.
- The OBV broke its downtrend, line e, in early September, which was a bullish signal.
- There is first support at $132.60-$133.50, which was the early October high.
- The rising 20-day EMA is at $130.13.
Boise Cascade (BCC) is a $1.4 billion wood products company that was down 2.78% on Monday, but is still up over 22% for the year.
- On October 27, BCC closed at $33.50 and was 48th on the Top 50 list.
- The stock climbed to $37.02 last week and is now 39th on the list.
- The stock closed last week above the weekly starc+ band for the third week in a row, signaling that it was a high risk buy at that price.
- The weekly chart shows that BCC completed its 18 month triangle formation, lines f and g, in early August.
- This formation has upside targets in the $40-$42 area.
- The relative performance bottomed out last summer, line i, and has now moved above longer-term resistance (line h).
- The weekly OBV broke its downtrend, line j, in June, which was well ahead of prices.
- The OBV retested its WMA (see arrow) last month.
- The 20-day EMA is now being tested with the minor 38.2% Fibonacci support at $34.
- The monthly pivot is at $33.44.
NEXT PAGE: Two More Stocks That Also Moved Up the IBD Top 50 List
|pagebreak|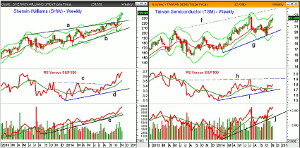
Click to Enlarge
Sherwin-Williams (SHW) is a $23 billion company that has been outperforming the SPY all year as it is up 31.61% YTD. On October 27, SHW was 45th on the Top 50 list and has since moved up to 41st.
- The weekly chart shows that SHW broke out above its upper trading channel, line a, four weeks ago.
- The weekly starc+ band has been tested for the past two weeks and the quarterly projected pivot resistance at $235.74 has been exceeded.
- The relative performance moved through the resistance, at line c, three weeks before the lows.
- The RS line has now confirmed the recent highs.
- The weekly OBV has also confirmed prices as it has moved to dramatic new highs over the past month.
- The daily OBV (not shown) has also made new highs with prices.
- The first good support comes in the $229-$231.40 area, which corresponds to the October highs and the 20-day EMA.
Taiwan Semiconductor (TSM) is a huge $113.6 billion dollar company that now yields 1.83%. It has just moved slightly up the list from 44th to 42nd.
- TSM did drop below the several month support at $19.68 in October, which hit many stops and likely lowered its rating.
- Despite the recent rally, it is still well below the weekly starc+ band at $23.09.
- The upper trend resistance, line f, is now at $23.90.
- The relative performance moved back above its WMA a week before the market bottomed.
- The RS line is holding above its WMA but still below major resistance at line h.
- The weekly OBV has already surpassed the July highs and is acting stronger than prices.
- TSM was down 2.19% Monday and is now quite close to its 20-day EMA at $21.74.
- The quarterly pivot is at $20.85, which is very close to the minor 50% retracement support.
What it Means: In addition to my regular weekly scans—like the one I discussed yesterday—the IBD Top 50 list is also a good place to find stocks for your watch list. I will occasionally find a stock on their list that I do not follow which helps me broaden my universe of stocks.
Of the four stocks, Taiwan Semiconductor (TSM) is the only one that is not extremely overextended on the upside and is clearly one of the survivors in this industry group. My second favorite would be Sherwin-Williams (SHW) if it gets a decent pullback.
How to Profit: No new recommendation.


