When you see downside targets being dropped multiple times, it is often a sign that bearish sentiment has reached extreme levels, so MoneyShow’s Tom Aspray studies the technical and sentiment outlook for crude oil and two energy stocks to determine what may happen next.
The higher opening in crude oil Wednesday was negated by a much weaker than expected Retail Sales report as stocks were hammered once again. The weak sales seem to be in conflict with other data on the consumer, which suggests they are more optimistic than they have been in many years.
We get new inflation data today and tomorrow, but I will be even more interested in the mid-month Consumer Sentiment report from the University of Michigan. If it comes in significantly higher than the consensus estimate of 94, it will have more questioning the retail sales data.
The market was also hurt by the weak earnings from JP Morgan Chase (JPM), which closed down 3.45% on the day. The weakness in the financial sector was consistent with the negative technical outlook and Bank of America (BAC) reported weak earnings this morning. The stock was down 2.5% Wednesday and has lost another 2.5% in pre-opening trading Thursday.
The major averages tested their quarterly pivot support Wednesday but did close above the day’s lows. A weekly close below their quarterly pivot levels (Pivotal 1st Quarter Price Levels) would further weaken the technical outlook.
Many are wondering whether Wednesday’s $2.45 rally in March crude oil is the start of a stronger rally that could help stabilize the stock market. Quite a few others agree with last week’s Barron’s article, where an analyst lowered his crude oil target to $20. A technical and sentiment outlook for crude oil as well as two key energy stocks may help to prepare you for what is going to happen next.
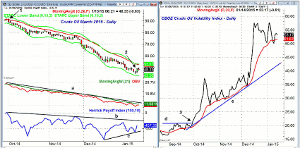
Chart Analysis: The daily chart of March Crude Oil shows that a daily high close doji buy signal was triggered by Wednesday’s close, point 2. A drop below $44.78 would reverse this signal.
- In early trading Thursday, crude has gained another $0.80.
- The declining 20-day EMA is now at $52.67 with the daily starc+ band at $53.32.
- The monthly pivot is at $58.77 or about $9 above current levels.
- The daily OBV is still well below its declining WMA, though volume Wednesday was the highest of the year.
- The Herrick Payoff Index, (based on volume, price, and open interest) has formed a positive divergence, line c.
- To confirm the divergence, the HPI needs to move above the early January high and the downtrend, line b.
- The HPI needs to move above the zero level to signal that money flow is positive.
The CBOE Crude Oil ETF Volatility Index (OVX) measures the market’s expectation for the 30-day volatility in crude oil prices by applying the VIX methodology to the United States Oil Fund (USO).
- The OVX completed is bottom on September 29, point 3, as it moved strongly above its resistance (line d).
- On the chart of crude oil (point 1), you can see that crude closed on September 29 at $91.71.
- The OVX was in a solid uptrend in October and November but accelerated to the upside in December.
- The daily chart reveals the twin peaks that formed in December and early January.
- The OVX is still holding above its rising 20-day EMA.
- A drop below the 50 level should be a positive for crude oil prices.
- The longer-term uptrend in the OVX is now in the 42-43 area.
- A daily close above 59.25 would be an upside breakout.
Next: Two More Energy Stocks to Watch
|pagebreak|
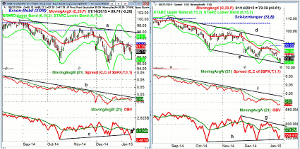
Exxon Mobil Corp. (XOM) dropped to a low of $87.26 on Wednesday, but then closed at $89.74. This low was well above the December low of $86.19.
- XOM came close to the daily starc- band at $87.20.
- The monthly projected pivot support is at $85.53.
- The quarterly pivot at $91.78 and 20-day EMA were slightly exceeded last Friday.
- The declining 20-day EMA is now at $91.39.
- The daily relative performance has been identifying XOM as being weaker than the S&P 500 since early August.
- The RS line made its low in December, but is still below its downtrend.
- The OBV has broken to new lows this week as support at line c, was broken.
- Volume on Wednesday was the heaviest since December 19.
- A close above $92.78 would be a short-term positive.
Schlumberger (SLB) dropped to test the daily starc- band Wednesday before closing higher. It has dropped over 11% in the past month.
- The monthly pivot support is at $74.32 with the weekly starc- band at $69.19.
- The daily relative performance peaked in late June and has been in a well established downtrend, line f.
- The RS line made a new low this month and is still below its WMA.
- The daily on-balance volume (OBV) turned up Wednesday and is trying to hold support at line h.
- The OBV is below its declining WMA with further resistance at the downtrend, line g.
- The weekly OBV dropped below its WMA two weeks ago.
- The declining 20-day EMA is $82.98, which is 5.8% above current levels.
- The monthly pivot is a bit higher at $84.01.
What it Means: As I have been mentioning for the past few weeks, the crude oil market is overstretched on the downside. This does favor a further rally as does the HCD buy signal.
When you see downside targets being dropped multiple times, it is often a sign that bearish sentiment has reached extreme levels. As noted in the recent Barron’s article, several analysts have just lowered their targets for crude oil from $45 to $20. The open interest in crude oil has risen 9% on over 100,000 contracts since the start of the year, so there are plenty of shorts to be squeezed.
With no strong daily buy signals, a stronger rally is likely to be followed by another decline, but it would take some time for an important low to be formed.
Some of the largest and most financially strong energy companies are also looking sold out. Their yields look pretty attractive compared to the 10-Year Treasury and I think very weak earnings in the energy stocks may already be factored into their prices.


