Picking the best stocks to hold for 2015 is a tough task for any analyst, so MoneyShow’s Tom Aspray takes a look at those stocks selected by last year’s winner amongst the ten Barron’s roundtable panelists.
The stock market got smacked in late trading Wednesday after the ECB announcement on Greek debt. The selloff was not enough to erase the positives from the market’s gains early in the week. The quick reversal in crude oil did not help but don’t think the short covering rally is over yet.
In Wednesday’s technical review Do Stocks Have Enough Juice to Breakout? I emphasized that a pullback would not be surprising but it was a higher weekly close that would shift the balance of evidence towards even higher stock prices.
Of course, we have the monthly jobs report on Friday, and while a much weaker number will keep those on the short side happy, a surprisingly strong number will make them very nervous. The breakout in the NYSE A/D line does support the bullish case.
The key weekly levels to watch are at $199.45 in the Spyder Trust (SPY) and 10,547 in the NYSE Composite. A weekly close well above these levels will improve the weekly technical outlook. For the S&P 500 futures, a close above 2062.50 is needed to signal an upside breakout.
As I noted two weeks ago, the Barron’s roundtable panelists were not expecting strong market gains in 2015. They also provide a list of their favorite stock picks for the year ahead. Now I have often pointed out that picking stocks to hold for the entire year is a fool-hardy exercise, especially for a technical analyst.
Nevertheless, I do find their choices can provide good material for my watch list. Last year’s winner was Abby Joseph Cohen from Goldman Sachs whose picks last year were up 9%. This illustrates what a tough year it was for stock pickers.
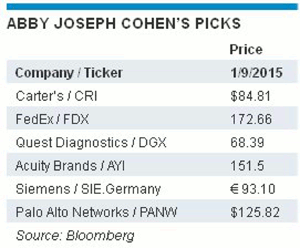
Abby’s had five picks for 2015 which are listed in the table above. From a monthly and weekly technical review of these stocks, one stands out as the best bet for new buying.
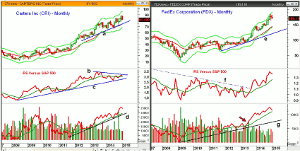
Chart Analysis: Carter’s Inc. (CRI) is a $4.3 billion marketer of apparel for babies and young children. The stock was up 22.68% in 2014 but is down 4.54% in the past month.
- CRI closed last Friday well below the quarterly pivot at $82.49.
- The stock has rebounded this week so the Friday close will be important.
- The monthly projected pivot resistance is at $85.90.
- The monthly relative performance peaked in 2013 and has formed lower highs, line b.
- A drop below the RS line support at line c, would be more negative.
- The monthly OBV did confirm the recent highs and is well above the long-term support at line d.
- The weekly OBV (not shown) is trying to turn up but is still below its WMA.
- The monthly projected pivot support is at $79.15.
- The next monthly support is at $77.50 which was the November low.
FedEx Corporation (FDX) suffered a price shock in December in reaction to sharply lower quarterly earnings as it hit a low of $163.57.
- The close last Friday at $169.11 was just above the quarterly pivot at $168.53.
- The 20-month EMA is significantly lower at $143.90.
- The relative performance broke its long-term downtrend, line f, in September 2013.
- The RS line has continued to make higher highs and has confirmed the price action.
- The monthly OBV also surged to the upside in 2013 (see arrow).
- The OBV has turned lower over the past two months but is still above its WMA.
- The weekly OBV has formed lower highs and is just slightly below its WMA.
- The daily momentum is negative so a test of the December lows is possible.
Next: Two More of Barron’s Top Stock Picks to Watch
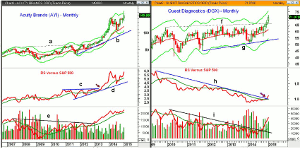
|pagebreak|Acuity Brands (AYI) is a $6.6 billion provider of commercial and residential lighting solutions that is trading just 1.92% below its 52-week high at $155.97.
- The short-term support and the 20-day EMA are now in the $149.59 area.
- It did form a doji two weeks ago with a low of $147.32, so a weekly close below this level would be negative.
- The breakout level on the monthly chart is in the $143.50-$145.68 area.
- The monthly RS staged an upside breakout in July 2013 as resistance at line c, was overcome.
- The RS has been rising sharply for the past few months and is close now to the early 2014 high.
- The monthly on-balance volume (OBV) broke through its major resistance, line e, in 2012.
- It is still rising and is above its WMA as are the weekly/daily OBV.
- The daily starc+ band is at $158.90 with the weekly at $164.67.
Quest Diagnostic (DGX) is a $10.3 billion provider of medical diagnostic testing that has a yield of 1.84%.
- The monthly chart shows that it closed above major resistance, line f, in December.
- The breakout level at $66.16 corresponds to the January lows.
- The weekly starc+ band is at $74.97 with the monthly at $75.90.
- The width of the trading range, lines f and g, has upside targets in the $78-$80 area.
- The monthly relative performance has just broken its downtrend, line h.
- The weekly RS analysis completed its bottom in December.
- The monthly OBV also looks strong as the long-term downtrend, line i, was overcome last September.
- There is initial support now at $70.11 and the 20-day EMA with stronger at $68.40-$69.
What it Means: Of the five stocks, the long-term breakout makes Quest Diagnostic (DGX) look the most attractive, but it needs a pullback before I would buy. The other recommended stock, Palo Alto Networks (PANW) formed a doji in December and has been testing its monthly starc+ band, so it is a high risk buy at current levels.
Both FedEx Corporation (FDX) and Acuity Brands (AYI) look as though they could correct further over the near term and would wait for more signs of bottoming.
Carter’s Inc. (CRI) looks positive but could top out in the next month or so and would not chase the long side.
How to Profit: Quest Diagnostic (DGX) go 50% long at $69.46 and 50% long at $68.07 with a stop at $65.37 (risk of approx. 4.9%).


