There is a high degree of bearish sentiment towards big oil these days, so MoneyShow's Tom Aspray takes a technical look at the charts to spot key levels where big oil stocks might bottom out and produce buying opportunities.
Another mixed close for the stock market with the Dow Industrials and S&P 500 slightly lower but the Dow Utilities closed strong, up 2.24% on the day as they rallied sharply from support after the release of the FOMC minutes.
The market internals were positive and the S&P 500 joined the NYSE A/D line by making a new high with prices. The sharp drop in crude oil did not help the stock market and the HPI indicates the money flow is no longer keeping pace with prices. Therefore, the rally in crude oil (Crude Oil Money Flow Turns Positive) may be over.
The Sector Select Energy (XLE) was down 1.19% Wednesday and has a one-year performance of 3.95%. This is quite disappointing when compared to the 16.28% gain in the Spyder Trust (SPY) over the same period.
The February 14 Barron's article Avoid Big Oil presented their view that four of the largest oil companies-Exxon Mobil (XOM), Chevron Corp (CVX), ConocoPhillips (COP), and Royal Dutch Shell (RDS-A)-were priced for $80 crude so have little growth potential. Then, on Tuesday, filings by Warren Buffett's Berkshire Hathaway revealed that he had sold his entire $3.7 billion stake in Exxon Mobil (XOM).
Does this high degree of bearish sentiment mean that investors should be looking
for a buying opportunity in these stocks? A look at the monthly charts will
pinpoint the key levels where these stocks may bottom out.
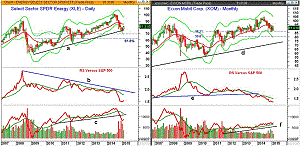
Chart Analysis: The Sector Select Energy (XLE) has total assets of $13.55 billion, a yield of 2.46%, and an expense ratio of 0.15%. There are 43 holdings with over 62% in the top ten, including ExxonMobil (16.2%), Chevron (13.2%), and ConocoPhillips (3.8%).
- The monthly support that goes back to the March 2009 lows is now being tested.
- The major 38.2% retracement support at $76.32 was violated on the decline as the low in January was $71.70.
- The monthly starc+ band is at $68.79 while the 50% support stands at $68.89.
- The relative performance shows a long-term downtrend, line b.
- The RS line dropped below its WMA in August and shows no signs of bottoming.
- The monthly OBV dropped below its WMA in October.
- The longer-term OBV support at line c, was subsequently broken.
- The 20-week EMA at $81.67 has just been tested with the 20-day EMA at $79.19.
Exxon Mobil Corp. (XOM) has a market capitalization of $382.3 billion and currently yields 3.00% as it pays a dividend of $2.76. At the January low of $85.39, the yield was 3.23%.
- The 38.2% Fibonacci support was tested in January with the 50% support at $80.40.
- The monthly starc- band is at $79.39.
- The major uptrend from the 2002 low, line d, is in the $72 area.
- The relative performance violated multi-year support, line e, in June 2013.
- The monthly OBV has been above its WMA since November 2011.
- The OBV has stronger support at line f.
- The weekly OBV has rallied from its lows but is still well below its WMA.
- There is resistance now in the $93.45 to $94.47 area.
Next: Two More Oil Company Stocks to Watch
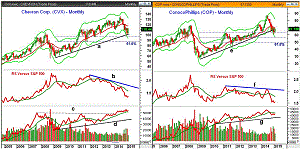
|pagebreak|Chevron Corp. (CVX) is a $208.78 billion dollar company with a yield of 3.80%. It currently pays a dividend of $4.28 and has boosted its dividend for twenty-seven straight years.
- The monthly uptrend from the 2009 lows, line a, was tested in January.
- The January low at $98.88 was above the 50% support level at $95.85.
- The 61.8% support level is at $86.89 and it corresponds to the September 2011 low.
- The monthly RS line has been forming lower lows since 2012, line b.
- The monthly OBV broke through major resistance, line c, in February 2014.
- The OBV has held above its WMA during the correction with major support at line d.
- The weekly OBV just tested its declining WMA on the recent rally.
- A move above the resistance at $113.30 is needed to keep the rally intact.
ConocoPhillips (COP), with a market cap of $83.3 billion, is considerably smaller than the other two. It has a yield of 4.20% and pays a dividend of $2.92.
- COP spiked to a high of $85.31 in July and is down 20.6% from the highs.
- The monthly uptrend, line e, was broken on a closing basis in January.
- COP is trying to hold the 38.2% support with the 50% support at $56.05.
- The monthly starc- band is at $56.40 with the 61.8% support at $49.00.
- The monthly RS line turned lower from resistance at line f, last summer.
- It has dropped sharply since it dropped below its WMA in September.
- The monthly on-balance volume (OBV) also dropped below its WMA but has been holding firm.
- The weekly studies look the best on COP.
What it Means: The monthly analysis does not yet suggest that a bottom is in place, but still I am surprised that Berkshire Hathaway dumped their stock in Exxon Mobil Corp. (XOM) as they normally have a long-term perspective.
Though Barron's does bring up some valid concerns that big oil's dividends may need to be covered in part by new debt, I still think they should be considered by income investors. I also think that they have some growth potential in the next year or so.
For most income investors, the best strategy would be to buy at different price levels instead of waiting for new buy signals. One strategy would be to buy 1/2 of the position at or below the recent lows and another 1/2 at 5-8% below the recent lows. Use the long-term support and retracement levels for a guide.
ConocoPhillips (COP) certainly looks the best technically.
How to Profit: No new recommendation.
I will be on vacation next week and the next Daily Chart will be released on March 2nd.
Some of Tom's Most Popular Articles:
Abby's
Roundtable Picks for 2015
Are
These Tech Stocks Ready for Lift Off?
Do
Stocks Have Enough Juice to Breakout?


