A recent cut in the revenue forecast by this integrated digital technology company has hit the stock hard and added pressure on the semiconductor stocks, so MoneyShow’s Tom Aspray takes to the charts to determine if this is just an isolated case or if the whole industry group is now in trouble.
The stock market was quiet as the FOMC started their meeting on Tuesday. All three of the Dow averages were a bit lower while the Nasdaq Composite and Nasdaq 100 recorded modest gains. The market internals were slightly negative on the day. Much stronger A/D ratios are needed to signal that the correction is actually over.
Of course, it is unlikely that today’s action will be as quiet as the fireworks are likely to begin about 2:00PM EDT and could last until the close of trading. The daily charts do allow for a drop back to last week’s lows before a short-term bottom is completed. Therefore, one cannot rule out another wave of selling before the correction is over. The futures are lower in early trading.
Reviewing those stocks and sectors (like healthcare) that are outperforming the S&P 500 still supports the conclusion that the current decline is a buying opportunity. The best thing for the markets, no matter how we close today, will be the fact that the market’s senseless angst over the Fed’s language will be over. Hopefully, by the April FOMC meeting, more investors will understand my view (Don’t Get Fooled Again) that higher rates are not necessarily negative for stocks.
The recent cut in the revenue forecast by Intel Corp. (INTC) has hit the stock hard and has added pressure on the semiconductor stocks. Is this just an isolated case or is the whole industry group now in trouble? What does this mean for the semiconductor positions that were recommended in January?
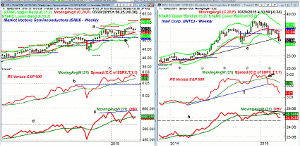
Chart Analysis: The Market Vectors Semiconductor (SMH) completed its flag formation on February 13. It is up 2.98% YTD more than double the performance of the SPY.
- The rally peaked at $58.47 at the start of March and the weekly starc+ band is now at $60.53.
- The quarterly projected pivot resistance is a bit higher at $61.11.
- The breakout level just below $55 was tested last week along with the 20-week EMA.
- The 20-week EMA is at $54.37 with the weekly starc- band at $52.34.
- The weekly relative performance made a new high with prices and is still well above its rising WMA.
- The weekly OBV did make a new high on February 27, but is now back below its rising WMA.
- The daily OBV (not shown) is below its WMA and still looks corrective.
- Initial resistance at Monday’s high of $56.69 with the daily starc+ band at $57.48.
Intel Corp. (INTC) is down close to 12% in the past month and 15% lower YTD.
- The close last week was below the weekly uptrend, line e.
- The weekly starc- band is at $29.42 with the 50% support at $29.15.
- The relative performance dropped below its WMA on January 30.
- The RS line has broken its uptrend, line f, and is declining more sharply.
- The OBV has also dropped below its WMA with trend line resistance at line g.
- The OBV is still well above long-term support at line h.
- The daily studies (not shown) topped out in the middle of December.
- They are still negative and they show no signs yet of bottoming.
- There is short-term resistance now at $31.50 with the 20-day EMA at $32.62.
Next: Two More Stocks in the Semiconductor Sector to Watch
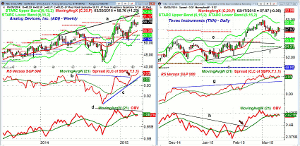
|pagebreak|Analog Devices (ADI) is a $17.07 billion designer and manufacturer of integrated circuits that is up 6.56% YTD.
- The stock hit a high of $59.71 two weeks ago and is just 1.7% below this high.
- The monthly projected pivot resistance is at $61.17 with the weekly starc+ band at $62.93.
- The upper trend line resistance, line a, is in the same area.
- The weekly RS line broke through its resistance in the middle of February.
- The RS line made another new high last week and is well above its sharply rising WMA.
- The weekly on-balance volume (OBV) did not make a new high with prices.
- A drop to new lows for the year would confirm this bearish divergence.
- The OBV is trying to turn higher this week.
- There is initial support at $56.68 with the rising 20-week EMA at $55.09.
Texas Instruments (TXN) has done even better than ADI so far this year as it is up 9.06% YTD.
- TXN completed its trading range, lines e and f, with the strong close on February 10.
- The high at $59.99 was close to the monthly starc+ band and TXN is down 3.3% from the high.
- The daily starc- band is at $55.61 with stronger support at $55, line e.
- The monthly projected pivot support is at $54.31.
- The daily RS line did make a new high with prices.
- It has since been in a trading range and has held above support at line g.
- The daily OBV moved through its downtrend, line h, and confirmed the price action.
- The sharply higher high in the OBV is consistent with strong demand.
- A daily close above $58 will indicate the uptrend has resumed.
What it Means: The outlook for Intel Corp. (INTC) continues to look weak and even though it is a 16.25% holding in SMH, the correction so far looks normal. Over the next few weeks, we should know if this interpretation is correct.
The charts of Analog Devices (ADI) and Texas Instruments Inc. (TXN) do look much better.
How to Profit: No new recommendation.
Portfolio Update: For Market Vectors Semiconductor (SMH) should be 100% long at $53.79. Raise the stop to $52.85.
For Analog Devices (ADI) should be 100% long at $52.49. Raise the stop to $5387. Sell 1/3 at $62.58 or better.
For Texas Instruments Inc. (TXN) should be 100% long at an average price of $55.12. Use a stop at $53.86. Sell 1/2 at $62.84 or better.


