By Alan Northam of TradersClassroom.com
Tekelec (TKLC) is part of the technology market sector and engages in the design, development, and manufacturing of telecommunications products and services. Before I consider taking a trading position in this company, it is important for me to look at the overall picture of the security. Toward this end I start my analysis of Tekelec with a long-term view.
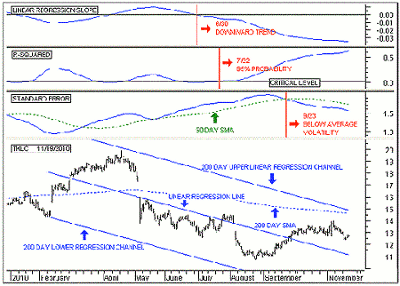
Figure 1 shows me the long-term picture of Tekelec. The bottom panel shows the price action from the beginning of 2010. On this chart, I have plotted the 200-day linear regression line and its upper and lower linear regression channels. As a result, I see that the linear regression line is sloping down, and since the linear regression line represents a trend line, I know that it is indicating that the long-term trend is in a downward direction. I also note that price has been trading below the 200-day simple moving average (SMA) and that it is also moving in a downward direction. I use the 200-day SMA here as a confirming signal that the long-term trend is down.
In the top panel, I have shown the linear regression slope indicator. This indicator tells me when the long-term downtrend started and whether it is continuing to move lower. I added a red vertical bar on June 30 when this indicator moved below its zero line to represent the date when the long-term downtrend started. I also see that this indicator continues to point down, indicating that the downtrend should continue. Seeing that the downtrend has been in motion now for four months and continues to point downward, and knowing that long-term trends last from several months to several years, I feel confident this long-term downtrend should last for quite some time.
In the second panel, I have shown the R-squared indicator, which represents the strength of the trend. Here I note that this indicator crossed above its critical level on July 22, indicating the presence of a strong downtrend. I also note that this indicator continues to move upward, indicating that the downtrend continues to strengthen. This gives me further confidence that the long-term downtrend will continue for quite some time.
In the third panel, I have shown the standard error indicator, which represents volatility. Volatility is a measure of the deviation of price from the linear regression line. Here I see that this indicator crossed below its 50-day SMA on September 23 and is now moving lower. This indicates that price is now starting to move down toward the linear regression line and away from the upper linear regression channel.
From this long-term analysis, I feel confident that the long-term downtrend should continue to move lower.
This chart shows the 200-day linear regression channel drawn on the price chart in the bottom panel, the linear regression slope indicator in the top panel, the R-squared indicator in the second panel, and the standard error indicator in the third.
The next order of business is to verify that the upward rally from the mid August low has turned down. For this analysis I turn to the next lower time frame, the intermediate-term time frame.
Article Continues on Page 2
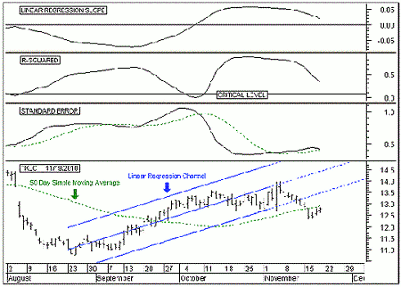
|pagebreak|Figure 2 shows the intermediate-term time frame for Tekelec. The bottom panel shows the price action from mid-August. On this chart I have plotted the 50-day linear regression line along with its upper and lower linear regression channels and extension lines. Note that from mid- to late-August, the linear regression line and its channel lines moved upward, indicating an intermediate-term upward countertrend within the long-term downtrend. Note also that more recently, price has broken below the extended lower linear regression channel, indicating the end of the current intermediate-term uptrend. However, this does not indicate that a new downtrend has developed but does indicate a change in trend. A change in trend could be a more shallow intermediate-term uptrend, a sideways trend (trading range), or a new intermediate-term downtrend. To help determine which of these three trends is developing, I turn my attention to the three indicators above the price chart in Figure 2.
In the upper panel of Figure 2, the linear regression slope indicator has been moving lower but is still above its zero line. This indicates that the 50-day linear regression line continues to rise but at a more shallow slope. It further indicates that with each passing day the slope of the linear regression line becomes more shallow. As long as the linear regression slope indicator continues to move lower, it will eventually move below its zero line and the linear regression line will start sloping down, signaling that a new intermediate downtrend has developed.
In the next panel is the R-squared indicator, which indicates the strength of the trend. This indicator is currently moving in a downward direction, indicating the linear regression line (trend) continues to weaken. However, I am also aware that as long as this indicator remains above its critical level, there exists a high probability that the 50-day linear regression slope indicator will not continue lower and cross below its zero line but could turn back up to indicate that a more shallow up-sloping linear regression line has formed. I must remain on the lookout for any indications that the linear regression slope indicator might start to turn up. This is where the standard error indicator can help.
The third panel down shows the standard error indicator. This indicator is a measure of volatility. In this chart, I see this indicator has been moving upward since late October and is now above its 14-day simple moving average. As long as this indicator continues to move upward, it is an indication that price will continue to move away from the linear regression line in the downward direction. This then informs me that the intermediate-term linear regression line should continue to roll over to the downside.
This analysis shows me that the intermediate-term uptrend should continue to weaken and eventually roll over to the downside. But I want more proof, so I turn my attention to a shorter-term time frame.
This chart shows the 50-day linear regression channel drawn on the price chart in the bottom panel, the linear regression slope indicator in the top panel, the R-squared indicator in the second panel, and the standard error indicator in the third.
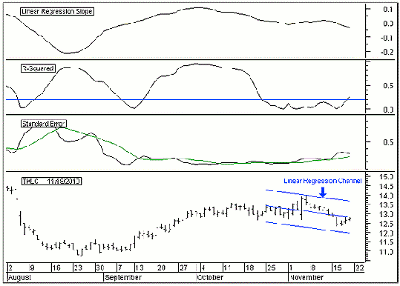
I know that the shorter the time frame I look at, the shorter the time a trend will last. However, if I can show that the shorter-term time frame is strengthening in the downward direction, it will give me confidence that price will continue to move lower over the intermediate-term time frame. In this analysis, I turn to the 20-day linear regression channel in Figure 3. Here I see that the linear regression channel is pointing down, informing me that over the shorter-term time frame the direction of the trend is also downward; a good sign.
In looking at the linear regression slope indicator in the top panel, I noticed that it had recently crossed below its zero line. Since short-term trends last from a few days to a few weeks, this informs me that the short-term downtrend should continue for at least a couple more weeks.
In the second panel from the top, I see that the R-squared indicator just moved above its critical level, informing me at a strong downtrend is now under way and tells me that there is now a 95% probability that the downtrend will continue for the next few weeks. So far, everything looks good and I should expect the intermediate-term trend to continue to roll over to the downside.
Article Concludes on Page 3
|pagebreak|Looking at the third panel from the top of Figure 3, I see the standard error indicator. This indicator is above its moving average and informs me that volatility is increasing. This further tells me that price is not sticking to the linear regression line (the middle blue line). As a result, price is now moving toward the linear regression line and if it is not going to stick to the linear regression line, then I expect to see price rise above it and continue higher toward the upper linear regression channel line. As long as the standard error indicator remains above its moving average, I expect to see price move between the boundary lines of the linear regression channel.
In conclusion, I believe that the long-term downtrend of Tekelec will continue for quite some time. I also believe that over the intermediate term, price is in the process of turning lower. And over the shorter-term time frame, I believe that the downtrend is just getting started and that there is a 95% probability that it will continue.
However, I also expect price to continue to move up toward the upper channel line of the 20-day linear regression channel. Therefore, I will wait for price to complete its short-term upward rally before taking a position in Tekelec. One trading strategy I might consider would be to wait until two price bars make lower highs and lower lows before taking a short position. I might then place a stop-loss just above the linear regression channel line.
As one final note, I might also look for the on-balance volume (OBV) indicator to move below its 20-day SMA as a confirming indicator before placing a short trade.
By Alan Northam of TradersClassroom.com


