The sharp rally in the bond market in 2014 has confounded most analysts but MoneyShow’s Tom Aspray explains how some recently released data has helped solve the mystery and what it may mean to investors.
The volatility certainly increased last week as Thursday’s decline was the largest in several months. The decline was consistent with the divergences in many of the daily technical studies that have been recently observed.
This—combined with the high bullish sentiment of financial newsletter writers and TV pundits—made me conclude last week that a more defensive posture was warranted. During the next few weeks, the technical readings should provide us a clearer picture of whether we will see a deeper market correction.
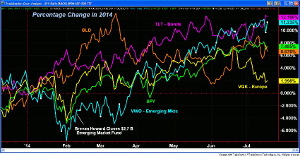
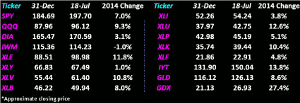
The asset performance chart for 2014 reveals that it has been a bumpy ride so far this year for all, except the bond holders. The SPDR Gold Trust (GLD) was up over 13% in March and then dropped to up just 1.3% in early June. It has rebounded nicely from the early June lows.
The Vanguard Emerging Market (VWO), which was last August’s Contrary Bet for 2014 was down over 7.5% in early February but is now up over 11%. The lows in VWO preceded the closing of one large emerging market hedge fund by just a few weeks.
The Spyder Trust (SPY) dropped briefly into negative territory in the middle of April before resuming its uptrend. The Vanguard European Stock Index (VGK) did better than the SPY early in the year but is now trailing by over 5%.
The iShares 20+ Year Treasury Bond (TLT) has been the key winner as it is up over 12% in 2014. The yield on the 10-Year T-Note dropped below 2.50% late last week but is still holding slightly above May’s spike low.
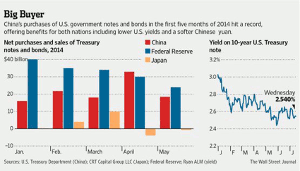
The recent data from the US Treasury Department has helped to solve the mystery over the sharp rally in the bond market despite the improving US economy. The heavy purchases of US bonds by China have already surpassed the $81 billion they bought in all of 2013. The chart shows that they bought over $30 billion in April when yields were in the 2.70% area.
This has helped weaken their currency, which is part of their efforts to stimulate exports. The GDP report from China last week was slightly better than expected but the debate over the health of their economy continues.
There are some reports that their depressed real estate market is now getting the attention of some overseas investors. If their exports do start to pick up then they may cut back on their bond purchases in the second half of the year.
The long side of the bond market is still looking crowded as the bullish sentiment seems quite high. Even though my recent recommendation on the short side of the bond market was stopped out for a small loss, I do expect yields to be higher by year end.
Both gold and crude oil underwent wide swings last week as the September crude oil contract hit a low of $98.68 but then closed the week near $102 per barrel. I would expect the volatility for both commodities and stocks to stay high as we head into August. Though this could create some good opportunities for traders, it will likely be more of a headache for investors.
Despite a few bright spots, most of the economic data last week was weaker than expected. The Retail Sales, Industrial Production, and Housing Starts reports were all below the consensus estimates. Despite the 9% monthly drop in starts, the Housing Market Index was better than expected as it got a boost from the New Home Sales.
The data on the manufacturing sector was better than expected as the Empire State Manufacturing and Philadelphia Fed Survey were much better than expected. The Fed survey hit its highest reading since March 2011.
NEXT PAGE: What to Watch
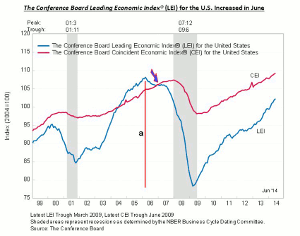
|pagebreak|The week ended with a disappointing report on consumer sentiment from the University of Michigan as it dropped to 81.3 from 83 last month. The Conference Board’s leading economic indicators also missed estimates but the long-term chart of the LEI as well as that of the Coincident Economic Indicator (CEI) still looks strong.
On the chart, you can see that the LEI turned lower in 2005 and did not drop below the CEI until early 2006, line a. This gave plenty of advance warning before the last recession.
There is more data this week on manufacturing with the Chicago Fed national activity index Monday and the Richmond Fed Manufacturing Index on Tuesday. Then on Thursday, we get the widely watched PMI Manufacturing Flash Index.
Also on Tuesday, we get the CPI and Existing Home Sales followed by Thursday’s New Home Sales report. The week ends with the latest data on Durable Goods.
The stock market’s nice rebound on Friday helped to stabilize the markets but that was not enough to change the view that we are building a short-term top. One can still not rule out new highs in the S&P 500 and Nasdaq 100 but it would take a couple of more days like last Friday to suggest we have started a new uptrend.
The intermediate-term trend is still clearly positive so we may see a broader trading range develop instead of a more serious correction. Many of the large tech stocks continue to move higher but are overextended while those that disappointed on earnings have been severely punished.
I would look at the relative performance analysis of your holdings and any you are considering as those stocks that are underperforming the S&P 500 and are being hit the hardest. The bullish percentage for the AAII dropped 5.3% last week as 5.5% moved into the neutral camp.
At the start of last week I recommended taking some profits on some stocks and tweeted further recommendations last Wednesday. Still have orders to sell, part of the position in the SPY and QQQ at higher levels.
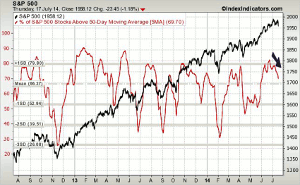
The five-day MA of the % of S&P 500 stocks above their 50-day MAs does now appear to have topped out as it was 67% as of last Thursday’s close. The next good support is in the 53% area which is one standard deviation below the mean. In general, I feel the market’s risk level is more acceptable in the 50% area and much more favorable at 40%.
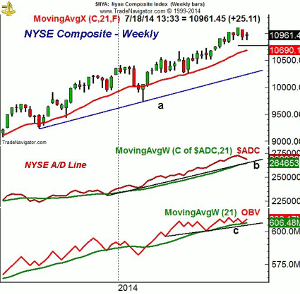
The weekly chart of the NYSE Composite (NYA) shows that the four week lows in the 10,880 level did hold last week with the quarterly pivot 10,758. The still rising 20-week EMA is a bit lower at 10,690.
A daily close back above 11,025 would be a short-term positive with monthly projected pivot resistance at 11,207.
The weekly NYSE Advanced/Decline did make a new high two weeks ago and confirmed prices. Though it is declining, the A/D line is still well above the support (line b) and its rising WMA.
The daily A/D line (not shown) also confirmed the early July highs but dropped Thursday to new lows for the month. The WMA has flattened out so the next few days will be important.
The McClellan Oscillator dropped into more oversold territory last week though did turn higher Friday. It shows no signs yet of completed bottom.
The weekly OBV has turned up from its WMA and did make new highs five weeks ago. It is still clearly positive and the first sign of weakness would be a drop below its WMA. The OBV has more important support at line c.
NEXT PAGE: Stocks
|pagebreak|S&P 500
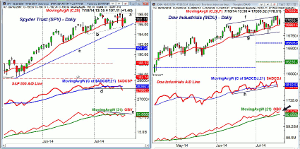
The Spyder Trust (SPY) hit a high last week of $198.26 which was just barely below the July 3 high of $198.29. The lower boundary of the short-term trading range, line b, was tested last week. There is more important support at $194.42 which is the monthly pivot.
The quarterly pivot is significantly lower at $191.24 with the April high and the 38.2% Fibonacci support at $188.80.
The close Friday was back above its 20-day WMA and a strong close above resistance at line a, would project a move to the $199-$201 area.
The S&P 500 A/D line dropped below support, line d, on Thursday, after spiking above its flattening WMA. The chart does not reflect Friday’s closing data (I will Tweet an updated chart over the weekend) and, therefore, I am not sure if the A/D line was able to move above its WMA. A drop below last week’s low would be a sign of more weakness.
The on-balance volume (OBV) shows a pattern of lower highs, line e, and is still below its WMA. Since SPY has not made a new closing high since early July, this is not a negative divergence.
Dow Industrials
The Dow Jones Industrials and SPDR Dow Industrials (DIA) tested their 20-day EMAs last Thursday before Friday’s rebound. The cash shows an upward trading channel, lines f and g, as it and DIA made new highs last week.
For DIA, the rising 20-day EMA is at $169.20 with more important support in the $167.50-$168 area. The quarterly pivot is at $165.45.
The daily Dow Industrials A/D did make a new high again last week but dropped below its WMA on Thursday. The WMA is still rising which is a positive sign.
The daily OBV on the cash made new highs last week and is holding well above its rising WMA.
Nasdaq 100
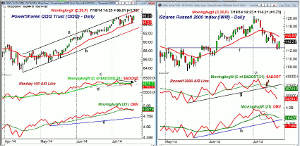
The trading channel on the PowerShares QQQ Trust (QQQ), lines a and b, is still intact as last week’s high at $96.30 was close to the monthly pivot resistance at $96.56. The quarterly projected pivot resistance is at $101.45.
The 20-day EMA at $94.51 was tested last week with the monthly pivot at $92.82. The monthly projected pivot support is at $91.49.
The Nasdaq 100 A/D line peaked on July 3 but failed to make a new high last week (line c). Thursday’s drop below support, at line d, was the first indication that the divergence was confirmed. A clear pattern of lower lows would suggest a further decline. The WMA is now declining slightly which is also a sign of weakness.
The daily OBV is acting a bit better but also did not confirm the recent high. A strong move back above its flat WMA would be a positive sign.
Russell 2000
The iShares Russell 2000 Index (IWM) dropped down to stronger support last week as the low at $112.20 was below the monthly pivot support at $113.64. Despite Friday’s rebound, the close was below the quarterly pivot at $115.05.
The declining 20-day EMA is at $115.85 and could be tested on a rebound this week. There is further resistance in the $116.50-$117.50 area.
The Russell 2000 A/D decisively broke its uptrend, line g, on July 9 and plunged further last week. It is now well below its declining WMA that could be tested on stronger rally. It would take some time before it could bottom out.
The daily OBV also violated its support from the May–June lows, line h, but turned up Friday. The weekly OBV (not shown) is also now below its WMA.
NEXT PAGE: Sector Focus, Commodities, and Tom's Outlook
|pagebreak|Sector Focus
The iShares Dow Jones Transportation (IYT) made further new highs last Wednesday at $150.45, which was above my initial profit taking level at $149.34. The rebound Friday erased the prior day’s losses and the monthly projected pivot resistance is at $151.45.
The weekly and daily relative performance analysis is still very strong and indicates this is a market leading sector. There are no signs yet for a top from the OBV analysis. The 20-day EMA and first good support is now at $147.74 with the monthly pivot at $145.88.
All of the ETFs on our weekly table are now in positive territory, but the Select SPDR Consumer Discretionary (XLY) is still lagging.
The strong bank earnings have boosted the Select Sector Financials (XLF) to almost a 5% gain for the year. My analysis last week does not make a convincing case that the big bands are becoming market leaders.
Most of the sector ETFs did not make new highs last week as Select SPDR Energy (XLE), the Select Sector Utilities (XLU), and Select SPDR Health Care (XLV) are still well below their recent highs.
The iShares Dow Jones Transportation (IYT) has surpassed the XLU as it is now up 13.6% for the year.
Select SPDR Technology (XLK) did make convincing new highs last week.
The PowerShares QQQ Trust (QQQ) has maintained its lead over the Spyder Trust (SPY), while the SPDR Dow Industrials (DIA) is now up over 3% for the year.
Crude Oil
The September crude oil held above the quarterly support at $97.95 last week as the low was $98.68. By Friday’s close, crude was up $1.90 per barrel for the week. The volume was high last week, consistent with the end of the correction. The weekly OBV held above its WMA and again has turned higher.
Precious Metals
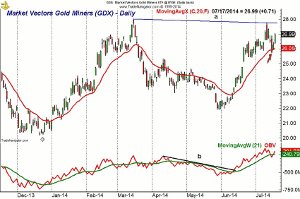
Both the Market Vectors Gold Miners ETF (GDX) and the SPDR Gold Trust (GLD) both closed the week lower but rebounded to close well off the week’s lows.
The daily chart of the GDX shows that it dropped back to the rising 20-day EMA last Wednesday before rebounding sharply. A strong move above the resistance, at line a, would be a convincing breakout. The daily OBV broke its downtrend, line b, in June, a few days after the lows. The OBV closed the week back above its WMA.
The Week Ahead
As I said last week, tops take longer to form than bottoms but new rally highs will need to be watched closely. Nevertheless, the various technical readings discussed in What to Watch do suggest to me that the market is a high risk area. Some are pointing to Friday’s rally as confirmation that buying the dip is the right strategy but time will tell.
Some of the stocks I suggested selling last week were forming daily dojis at strong resistance. This candle formation is a sign of indecision and is often followed by a pullback if not a top.
Even if we are going to see a 50% correction or more, I still like the dollar-cost-averaging approach to an ETF or mutual fund tied to the S&P 500. I also continue to like the large-cap ETFs that I previously recommended in A Portfolio That Won't Ruin Your Summer.
For stock traders, I think there will be better opportunities to buy in the coming weeks but if more stocks show up in my weekly scans I will not fight the tape. As I said last week, if you are still in the process of dollar cost averaging, do not be diverted if market volatility increases further.
Don't forget to read Tom's latest Trading Lesson, What's Next for Big Tech?

