
With only one week left in August, many analysts have begun to question what will happen to the stock market in September, so MoneyShow's Tom Aspray takes a technical view of the charts to see if September will bring about any buying opportunities.
To the surprise of the apparently cautious Wall Street analysts and hedge fund managers, stocks continued higher last week. Fund managers are holding a higher level of cash as they have a list of reasons why stocks can't go any higher.
In last week's column Are Wall Street Pros Too Negative? I pointed out that a recent survey of Wall Street strategists revealed they are recommending that their clients have just 51% in stocks. This is a level that has signaled a 22% gain in the following year.
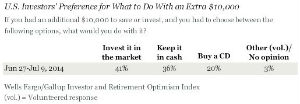
The public also seems to be oblivious to the stock market as a Wells Fargo/Gallup poll in June and early July made it clear that the small investor is not paying attention to the stock market.
Surprisingly, "the survey shows that while the majority of investors (64%) do
know that stocks increased on average in 2013, barely a quarter (24%) believe
they increased by 20% or better, and only 7% are aware that the average increase
was in the 30% range. The largest proportion—37%—believe
stocks increased by 10%, while another 21% think stocks were flat and 9% think
they decreased."
Click to Enlarge
The new highs in 2014 have not gotten these investors any more interested in the stock market as the survey results indicate. If given an additional $10,000, only 41% would invest it in the stock market while 56% would either keep it in cash or invest in a CD. This sentiment is clearly not consistent with the stock market bubble like 2000 that some are still worried about.
The hedge funds are a bubble that appears to be still losing air as I suspected in One Bubble Starting to Burst? Just released last week was the news that—as part of Citigroup's August 5 deal with the SEC—they will no longer be selling hedge fund products to wealthy clients. This follows action by Calpers and Goldman Sachs to limit their exposure and business with hedge funds.
The active investors followed in the AAII survey—I am sure—are well aware of what the stock market did last year and how it is doing this year. They have quickly become quite bullish as the percentage of bulls has risen from 30.89% on August 7 to 46.11% last week. This makes the market vulnerable to a pullback.
Just before the market turned sharply higher on August 8, the technical indicators suggested that we were close to a market low (Get Ready for a Rally). At the time, I was looking for a rebound that would likely fail. However, the strength of the rally has been impressive, which now makes it unlikely that the August lows will be broken.
With just a week left in August, what about the stock market in September? Looking back to 1950, it has not been a good month for stocks as it has been up 29 years but down 35. The average return has been -0.64%.
Click to Enlarge
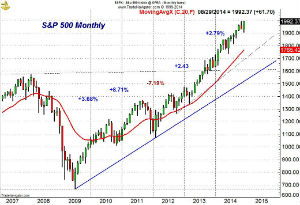
This data, in my opinion, must be viewed in terms of the market's technical outlook. As the chart indicates, since the bull market began in 2009, September has been quite a good month. The S&P 500 was up 8.71% in September 2010 when the NYSE Advance/Decline was positive, but down 7.19% in 2011 when it was negative.
Over the past five years, the average gain has been 2.08%, and current technical readings (see What to Watch) make it likely there will be a good buying opportunity in September and I would expect a higher monthly close.
The Euro zone markets peaked in June about a month ahead of the July high in the S&P 500. The German Dax Index dropped from its June 20 high of 10,050 to a low on August 8 of 8903. This was a decline of 11.4%.
The rebound from the lows has been sharp as it is up 5.6% in the last two weeks. This is despite deteriorating economic numbers even from Euro zone stalwarts like Germany. Clearly, the sanctions against Russia are playing a role. The Dax is reaching strong resistance in the 9480-9550 area, which may trigger a pullback.
Click to Enlarge
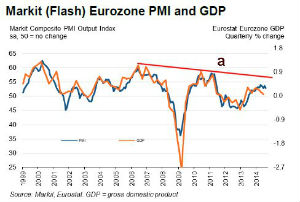
More signs of Euro zone weakness were evident in the Markit Flash Euro zone Composite PMI Output Index, which declined to 52.8 from 53.8 in July . The chart shows that the index—as well as the Eurostat Eurozone GDP—are both still in their downtrends from the highs in 2006 and 2010 (line a). It would probably take until next year before this downtrend could be broken.
The news on the US economy last week was good, especially for the housing market. The Housing Market Index rose nicely to 55 while the Housing Starts and Pending Home Sales both beat expectations.
Even more important was the sharp 0.3% rise in the leading indicators, which keeps it in a solid uptrend, consistent with an economy that is still improving. Part of this strength came from the manufacturing sector as new orders were strong.
NEXT PAGE: What to Watch
|pagebreak|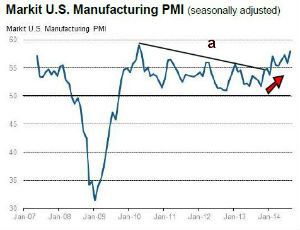
Click to Enlarge
Also last Thursday, the Markit US Manufacturing PMI jumped to 58 from 56.3 the previous month. Earlier this year, I noted that the downtrend in the PMI (line a) had been broken and this supported my positive outlook for the economy even during the difficult 1st quarter.
Monday we get the latest data on New Home Sales along with the Chicago Fed National Activity Index and the Dallas Manufacturing Survey. There is also a full slate on Tuesday including; Durable Goods, S&P Case-Shiller HPI, and Consumer Confidence.
On Thursday, the market will be watching the latest reading on the 2nd quarter
GDP as well as the Pending Home Sales Index. On Friday, as many traders leave
early for the long weekend, we will get the Personal Income and Outlays report
that includes the Fed's favorite inflation gauge. Also out is the Chicago PMI
and the University of Michigan Consumer Sentiment.
Last week I noted that there were significant changes in the technical outlook but not all of the indicators had broken through their key resistance levels. That changed last week as the market internals were strong and the new highs in the A/D lines for the NYSE Composite, S&P 500, and Nasdaq 100 now confirm that the worst of the selling is over.
The daily OBV analysis for all of the four index tracking ETFs is still not confirming the price action but the more important weekly OBV did make new highs last week.
Click to Enlarge
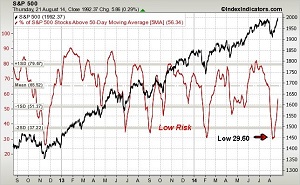
As I noted a week ago, the five-day MA of the % of S&P 500 stocks above their 50-day MAs had turned higher from a low risk area. The MA dropped to 29.6% on August 6 and rose to 30.64 on the 7. The sharp rally the following day confirmed that it had bottomed. The MA is now up to 56.34% which is still below the mean at 64.6%.
I took a look recently at some stocks that George Soros had dumped as well as the favorite stocks of one of Wall Street's biggest bulls. I will be doing weekly OBV scans next week to start on a shopping list as there is now plenty of cash in the Charts In Play portfolio.
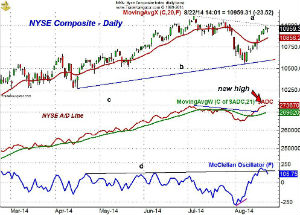
The NYSE Composite (NYA)
failed to make a new high Friday as the market sagged a bit after Janet Yellen's
comments. The rally has tested the downtrend, line a, from the prior highs.
There is initial support now at 10,855 and the rising 20-day EMA. The quarterly
pivot is at 10,755 with additional support at 10,680.
Click to Enlarge
The daily NYSE Advance/Decline broke its downtrend last Monday, which was followed by a move to all time new highs, line c, on Thursday. The weekly A/D line (not shown) also made a new high last week.
The McClellan Oscillator overcame major resistance at line d, on Monday, which I believe is a sign of strength. The oscillator turned lower Friday, consistent with a pullback early this week.
The Oscillator only formed a short-term bullish divergence at the recent lows (see line). As I discussed in last week's trading lesson, normally you would see a more significant divergence before such a strong rally.
Once above the downtrend, there is further resistance for the NYSE in the 11,000-11,105 area.
NEXT PAGE: Stocks
|pagebreak|S&P 500
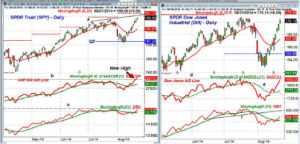
The Spyder Trust (SPY)
came very close to trendline resistance, line a, last week, as it made another
new all time high. The monthly projected pivot resistance is at $201.13.
There is initial support now at $198.50 with the rising 20-day EMA at $198.02.
Once we get one strong down day I will be able to identify the short-term Fibonacci
support levels.
The monthly pivot for August is at $195.04 and the quarterly pivot (QP) held nicely at the recent lows.
Click to Enlarge
The S&P 500 A/D line moved through its downtrend last week and made a new
high as the prior high (line b) was overcome. The A/D line is now well above
its rising WMA which could be tested on a pullback.
The on-balance
volume (OBV) moved further above its WMA last week but is still well below
the previous highs and therefore is not confirming prices. After a pullback,
more volume is needed to put the daily OBV in line with prices but the weekly
OBV (not shown) did make a new high last week.
Dow Industrials
The SPDR Dow Industrials (DIA)
rallied sharply last week but has not made it above the July 17 high of $170.83.
The quarterly pivot resistance is at $175.34.
The Dow Industrials A/D line has surged sharply higher after breaking its downtrend,
line e, on August 14. It subsequently formed a bullish zig-zag formation. It
is now just slightly below the all time high at line d.
The daily OBV is also lagging the price action as it is still well below the resistance (former support) at line f. The weekly OBV did make a new high last week.
Click to Enlarge
Nasdaq 100
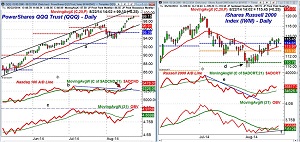
The PowerShares QQQ Trust (QQQ)
came very close to the monthly projected pivot resistance Friday at $99.27 as
the high was $99.25. The ability of the QQQ
to regain its former uptrend, line a, nine days ago was a positive sign.
There is initial support at $97.51 and the prior high, with the rising 20-day
EMA at $96.91. The monthly pivot is at $95.39 (courtesy
of John Person's software).
The Nasdaq 100 A/D line closed above the strong resistance, line b, on August 14. As I noted last week, this was typically a sign that the correction was over. Its WMA is now clearly rising and it should hold on any correction.
The daily OBV on the QQQ is acting much stronger than the daily OBV on the SPY as it is close to making a new high, line c. It is also now well above its rising WMA. The weekly OBV (not shown) is now well above the late July highs.
Russell 2000
The iShares Russell 2000 Index (IWM)
has had a more anemic rally as it is just barely holding above the quarterly
pivot at $114.61. There is further resistance in the $116.50-$117.50 area.
The daily Russell 2000 A/D line broke its steep downtrend, line e, in early August. It is in a gradual uptrend and above its WMA. It is still well below the prior highs.
The daily OBV is acting even weaker than the A/D line though it is trying to bottom.
The rising 20-day EMA is at $113.97 with more important support at $112.36. The quarterly projected pivot support (line d) supported prices in early August.
NEXT PAGE: Sector Focus, Commodities, and Tom's Outlook
|pagebreak|Sector Focus
The iShares Dow Jones Transportation (IYT) came very close to the previous high at $152.40 last week as it reached $152 last Thursday. Other than the gold and gold miners, it is the top performing sector YTD as it is up 14.5%.
The daily technical studies are positive but not acting stronger than prices. Both the weekly and daily relative performance are positive and indicate that it is a market leading sector.
The rising 20-day EMA is now at $148.25 and IYT held the 20-week EMA on the recent pullback. It is now at $143.51.
Click to Enlarge
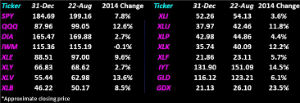
Six of the ETFs I track are now showing double digit gains for the year. The strong rally has pushed the Spyder Trust (SPY) up 7.8% but is still lagging the 12.6% gain for the PowerShares QQQ Trust (QQQ).
The SPDR Dow Industrials (DIA) is now up 2.7% while the iShares Russell 2000 Index (IWM) is still barely lower for the year.
The Select SPDR Energy (XLE)
is still below its highs but close to a double digit gain for the year. I recently
recommended some oil stocks as well as the SPDR S&P Oil & Gas Exploration
& Production (XOP)
in Digging
for Bargains. They need a strong weekly close to confirm that they have
bottomed.
I also examined the technical outlook for the utility sector as the Select
Sector Utilities (XLU)
is up 11.8% for the year.
The Select Sector Health Care (XLV) is not far behind the IYT so far this year as it is up 13.6%.
Click to Enlarge
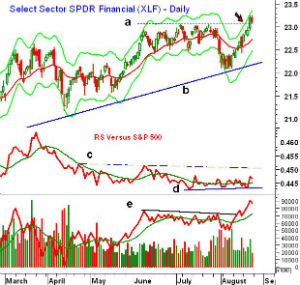
The most dramatic development last week was the new yearly high in the Select Sector Financials (XLF) as it has moved well above the resistance at line a. It was a bit lower Friday and has first good support in the $22.73-$22.85 area.
The daily relative performance is trying to bottom (line d) but needs to move
above resistance at line c to signal it is a market leader. The daily OBV was
leading prices higher as it broke through its resistance, line d, and made new
highs on August 13.
Interest Rates
The yield on the 10-Year Treasury Note was up slightly for the week
closing barely above 2.40%. Yields held in a narrow range last week.
Crude Oil
The October crude oil contract closed lower again last week, losing
$1.70 per barrel but did close above the week's lows. The weekly OBV has now
dropped further below its WMA.
Precious Metals
The Market Vectors Gold Miners ETF (GDX) and SPDR Gold Trust (GLD) were both lower for the week. The weekly momentum is close to turning negative as GLD made a new low for the past eight weeks.
The Week Ahead
The rebound I was expecting since August 7's Get
Ready for a Rally was much stronger than I expected. It looks somewhat
similar to the rally from the lows in the middle of November 2012 when a v-shaped
bottom was formed.
Still, there are many skeptics out there so I think a pullback between now and early September should be well supported and provide a good buying opportunity. Once again, the key focus should be on the risk of each position.
The wild card is still the situation in Ukraine as if we have another flare-up with Russia it could trigger a sharp pullback. I would expect the ECB to cut rates at their early September meeting, which could help support the Euro zone markets.
If you established even a 30% long position in stocks as I recommended at the end of May's A Portfolio That Won't Ruin Your Summer, I think you will be rewarded as we enter the more friendly fall months.
I think September may surprise many analysts as most consider it to be a month when stocks should be avoided. The new weekly and daily highs in the NYSE A/D lines do clearly favor the bullish case as they did in September 2010.
So there is no change for those who are in the process of a dollar-cost-averaging
plan as I would definitely stick with your plan. If you have not started one
yet, it is still not too late to start.
I also will be looking to add to the position in the PowerShares QQQ Trust
(QQQ)
if we get a decent entry point.
Don't forget to read Tom's latest
Trading Lesson, A Top-Notch Tool for Market Timing.
I will be off next week so the next regular Week Ahead column will be published
on September 5.


