
Completed bottom formations and improved growth prospects make these emerging market ETFs buy worthy, but only on sizable pullbacks to stronger support.
Since December 2011, many stocks have completed reverse head-and-shoulders (H&S) bottom formations and have rallied to their first targets. It is interesting that many of the emerging market ETFs show similar formations, and two of them, the iShares FTSE China 25 Index Fund (FXI) and the iShares MSCI Hong Kong Index Fund (EWH), were discussed in early December (see “3 Asian ETFs to Watch”).
See related: The Dominant Chart Pattern for Early 2012
Many of the emerging market ETFs have had little in the way of a pullback over the past six weeks, but even though my previously recommended buy levels were not reached, this is no time to chase these funds.
Completed bottom formations are typically followed by a fairly sharp pullback, and often times there is a retest of their breakout levels. Now that the US economy seems to have turned the corner, it should be positive for the emerging markets, and these three ETFs should perform well in 2012.
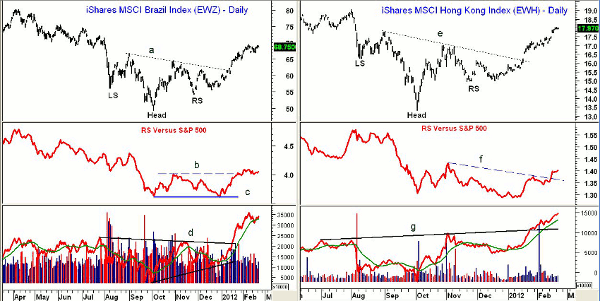
Click to Enlarge
Chart Analysis: The iShares MSCI Brazil Index Fund (EWZ) completed a reverse head-and-shoulders bottom formation on January 12 when the neckline, line a, was overcome.
- EWZ has just slightly exceeded the major 61.8% Fibonacci retracement resistance at $69.39, but has not closed above it
- There is further strong resistance in the $72 area with upside targets from the bottom formation in the $77 area
- Relative performance, or RS analysis, completed a double-bottom formation (lines b and c), which is consistent with an intermediate-term low
- The on-balance volume (OBV) has been very strong and has moved well above major resistance at line d
- There is now initial support for EWZ at $65.50-$66.50 with the 38.2% Fibonacci retracement support at $63.75
- The 50% support level and the neckline are now in the $60-$62 area
The daily chart of the iShares MSCI Hong Kong Index Fund (EWH) closed above the neckline (line e) of its reverse H&S formation on January 19 and has since accelerated to the upside.
- The 61.8% Fibonacci retracement resistance from the 2010 high of $20.26 has been decisively overcome
- The completion of the reverse H&S bottom formation has upside targets in the $20-$21 area
- The RS line has formed higher lows and has moved through its downtrend, line f. A move above the early-November highs will confirm that it has bottomed
- The daily OBV surged through six-month resistance, line g, in January, and is acting stronger than prices
- There is initial support now in the $16.75-$17.40 area with the current 38.2% support at $16.24
NEXT: Mexico ETF to Buy on a Correction
|pagebreak|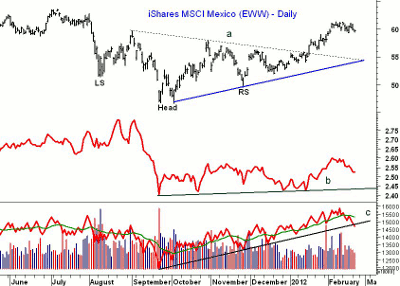
Click to Enlarge
The iShares MSCI Mexico ETF (EWW) has also overcome its 61.8% retracement resistance at $57.78. The reverse H&S bottom formation was completed in mid-January when EWW closed well above the neckline at line a.
- The chart formation has upside targets in the $68 area, which is well above the 2011 highs
- The RS analysis has not been impressive, as even though it has completed its bottom formation (line b) by moving above last fall’s highs, it is lagging the price action
- Daily OBV has been stronger, but it has now violated its uptrend, line c, and is well below its declining weighted moving average (WMA)
- Weekly OBV (not shown) looks stronger, as it made new highs in early February
- There is initial support for EWW at $57-$58.50 with the 38.2% support at $55.60
What It Means: My more conservative entry strategy did not work well for either the iShares MSCI Brazil Index Fund (EWZ) or the iShares MSCI Hong Kong Index Fund (EWH), as the sharp recent rallies were missed.
Still, do not chase any of these ETFs, and instead look to buy on sizable pullbacks to good support, which may not occur until March.
How to Profit: For the iShares MSCI Brazil Index Fund (EWZ), go 50% long at $64.62 and 50% long at $62.78 with a stop at $59.58 (risk of approx. 6.5%).
For the iShares MSCI Hong Kong Index Fund (EWH), go 50% long at $16.82 and 50% long at $16.34 with a stop at $15.36 (risk of approx. 7.5%).
For the iShares MSCI Mexico ETF (EWW), go 50% long at $57.42 and 50% long at $55.84 with a stop at $53.32 (risk of approx. 5.8%).


