
With market conditions improving, the tech sector is back in favor, and their positive chart patterns and superior relative performance analysis make these leading equities among the best ones to buy.
The improvement in the technical outlook for the Select Sector SPDR - Technology (XLK) discussed here last Friday turned my focus back on the technology sector. If the worst of the market’s decline is over, then those tech stocks with the best long-term charts and superior relative performance analysis should be a part of most portfolios.
The proposed bailout of Spanish banks has led to further optimism for stocks over the weekend, as has the better-than-expected economic news out of China. Stock index futures were sharply higher in overnight trading but have since given up some of the gains. Still, it is the close on Monday that will be most important.
A positive close, and more importantly, positive Advance/Decline (A/D) numbers on Monday could be enough to confirm the bottom formations for the A/D lines. Two of the tech giants, Intel Corp. (INTC) and Microsoft Inc. (MSFT), have been among my favorites since late last year.
Apple Inc. (AAPL) is set to announce product updates at today’s developer conference in San Francisco. AAPL came within 0.5% of my buy level from May 7 before rallying sharply and it now looks unlikely that the May lows will again be tested. Therefore, aggressive investors will need a new strategy for buying Apple.
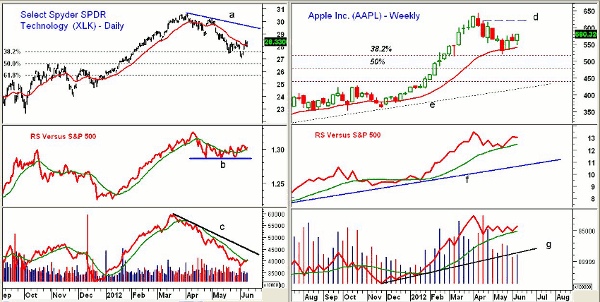
Click to Enlarge
Chart Analysis: The Select Sector SPDR - Technology (XLK) dropped as low as $27.04 last week before closing at $28.33.
- XLK appears to have successfully tested the long-term support from 2011 in the $26.88 area
- Daily chart shows that the 38.2% Fibonacci retracement support from the October lows was broken. The 50% support level is at $26.62
- Daily relative performance, or RS analysis, has been basing for the past two months, line b, and has moved above its weighted moving average (WMA)
- Daily on-balance volume (OBV) is barely above its declining weighted moving average and is still below its downtrend, line c
- The weekly RS analysis and weekly on-balance volume (OBV) studies (not shown) look more positive
Apple Inc. (AAPL) briefly dropped below its 20-week exponential moving average (EMA) four weeks ago, coming very close to the weekly Starc- band before rallying almost $60. AAPL makes up 18% of the XLK portfolio.
- The decline took APPL very close to its 38.2% Fibonacci support level at $516 with the 50% support level at $476.44
- The RS line tested its weighted moving average before turning higher. There is long-term support at line f
- Weekly OBV has turned up from its rising weighted moving average and confirmed the highs early in the year
- Daily OBV (not shown) has moved back above its weighted moving average but volume was not impressive at the end of last week
- 50% retracement resistance, as calculated from the high at $644, is at $582.50 with further chart resistance at $594-$600
- A move above the post-earnings high in the $618-$620 level, line d, would be very positive
- Minor support is at $560 and a drop below $548.40 would violate the short-term uptrend, suggesting a drop back to the prior lows is possible
NEXT: Best Buying Levels for Intel (INTC) and Microsoft (MSFT)
|pagebreak|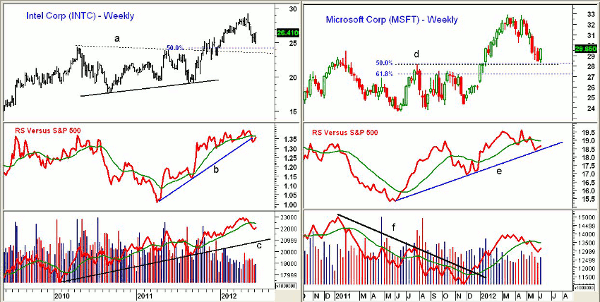
Click to Enlarge
Intel Corp. (INTC) violated its 38.2% Fibonacci retracement support at $25.42 on a closing basis two weeks ago but has held above the 50% support at $24.23.
- The weekly chart shows that INTC overcame major weekly chart resistance, line a, in 2011
- The completion of the weekly trading range still has upside targets in the $29-$31 area
- Despite the market correction, the RS line made new highs just over five weeks ago and has turned back up after slightly breaking its uptrend, line b
- Weekly OBV has also confirmed the new highs and turned up last week
- OBV has held well above its long-term uptrend, line c
- The midpoint of last week’s range is $25.66, which represents first support
Microsoft Corp. (MSFT) made a low last week at $28.32, which was just barely below the 50% retracement support at $28.38.
- The decline held just above the July 2011 high at $28.19. The 61.8% Fibonacci retracement support is at $27.29
- Weekly RS analysis shows a pattern of higher highs and higher lows
- The RS line has turned up from its uptrend, line e
- Weekly OBV broke its long-term downtrend, line f, last December
- OBV turned up last week but is still below its flat weighted moving average
- Daily OBV (not shown) is still below its weighted moving average
- There is initial resistance now at $30 with stronger resistance in the $30.63 area
What It Means: Last week’s market turnaround was impressive but does not mean that stocks are going to reverse course and simply head straight up. Though further wide swings in the major averages and futures are likely before the bottom is complete, I do not expect many of the market-leading stocks to retest their prior lows.
Therefore, light long positions are recommended on a slight pullback, and buyers could then add to those positions at stronger support. The risk is highest in Apple Inc. (AAPL), but investors can also get some exposure to the stock by buying the Select Sector SPDR - Technology (XLK).
How to Profit: For the Select Sector SPDR - Technology (XLK), go 50% long at $28.12 and 50% long at $27.62 with a stop at $26.48 (risk of approx. 5%).
Aggressive investors can go 50% long Apple Inc. (AAPL) at $566.80 and 50% long at $559.60 with a stop at $545.65 (risk of approx. 3.1%).
For Intel Corp. (INTC), go 50% long at $25.88 and 50% long at $25.44 with a stop at $23.94 (risk of approx. 6.7%).
For Microsoft Corp. (MSFT), go 50% long at $29.20 and 50% long at $28.84 with a stop at $27.68 (risk of approx. 4.6%).


