The high bearish sentiment and seasonal trends for gold created a good risk-reward entry point in July, although those not yet long should concentrate on the metals, not the miners, writes MoneyShow’s Tom Aspray.
The gold futures and leading gold ETFs have rallied over the past several weeks, with SPDR Gold Trust (GLD) up 4.8% from the late June lows. It has been almost a year since GLD peaked at $185.85 on September 6, 2011.
This seasonal chart of gold futures that I discussed in early July shows that it typically bottoms in July.
The markets are closely watching this week’s FOMC meeting as well as the ECB’s policy meeting on Thursday for further signs of easing. The sentiment on gold has become quite negative over the past few months, as several of the diehard gold bulls have voiced a more cautious outlook.
The Swiss bank UBS early Tuesday raised their monthly gold target to $1,700, and their three-month target to $1750. The gold market needs some impulsive price action to confirm the lows, but as I discuss below, the technical outlook has improved for gold, if not the gold miners.
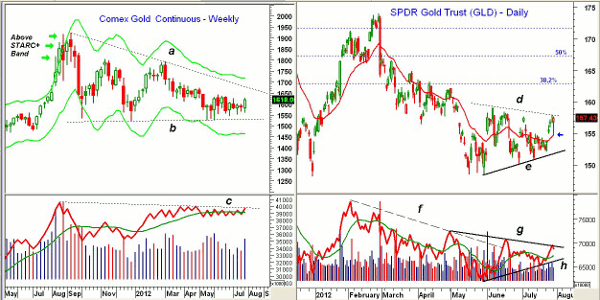
Chart Analysis: The weekly chart of the Comex gold futures shows that last week’s close was the highest in the past six weeks. The December gold contract needs a decisive close above $1,646 to complete the bottom formation.
- The upper boundary of the flag formation is in the $1,674 area, with the major 38.2% Fibonacci retracement resistance at $1,690. The weekly Starc+ band stands at $1,717.
- In August 2011, gold closed above its weekly Starc+ band for three successive weeks (see arrows), which set the stage for gold’s the next month.
- The weekly on-balance volume (OBV) has been in a narrow range for the past four months, and is now testing key resistance (line c).
- The volume increased significantly last week, which is a positive sign.
- The monthly OBV (not shown) has turned up and is testing its WMA.
- There is initial support for December gold at $1,600 and the rising 20-day EMA with stronger levels in the $1,666 to $1,680 area.
- A decisive close below $1,535 would abort the bottoming formation.
The SPDR Gold Trust (GLD) rebounded sharply Monday from the low at $154.81 to close at $157.45. There is daily trend line resistance (line d) now at $159.20.
- GLD has the major 38.2% Fibonacci retracement resistance just above $163, with the 50% level at $167.60.
- The volume in GLD has not been as strong as it has been in the futures, as the OBV has near term resistance at line g.
- The longer-term downtrend (line f) was overcome in June, so the June high is an important level of resistance to watch.
- The trading since May (lines d and e) could also be a bear flag formation that would mean another break to the downside before a bottom is completed. This was my favored scenario a few months ago, but now looks much less likely.
- A break in the OBV below support (line h) would be a sign of weakness.
- The 20-day EMA is at $154.55 with further support in the $152.20 to $153.50 area. There is more important support in the $150 to $151 area.
NEXT: 2 More Gold ETFs...But Which Should You Buy? |pagebreak|
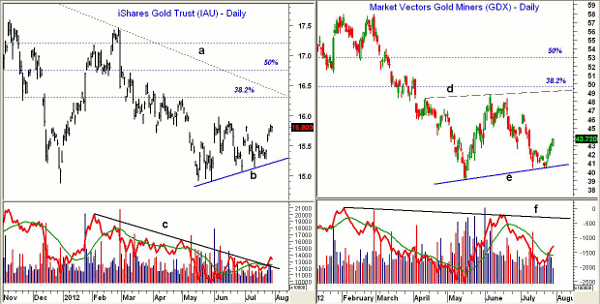
The iShares Gold Trust (IAU) closed just below resistance in the $16 area on Monday.
- The long-term downtrend (line a) and the major 38.2% Fibonacci retracement resistance is in the $16.30 area. The major 50% retracement resistance is at $16.75.
- The OBV has broken its downtrend (line c) and appears to be starting a new uptrend. A pattern of higher highs in the next week would confirm.
- There is initial support now at $16.50, which corresponds to the 20-day EMA. There is further support at $15.34 to $15.24 (line b) and then at $15.07.
- In late December 2011, IAU hit a low of $14.87.
The Market Vectors Gold Miners ETF (GDX) has formed higher lows (line e), as it has bounced from the recent lows at $40.40. GDX made a lower low in May at $39.08.
- The volume picked up last week, and the OBV has moved above its WMA.
- The daily OBV has major resistance at line f. The weekly OBV (not shown) is still below its WMA.
- GDX has next resistance at $44.84 and then $46.57.
- More important resistance waits at $49.22 (line d), with the major 38.2% Fibonacci retracement resistance at $49.68.
What it Means: It has been my opinion since last fall that gold and the gold ETFs would undergo corrections that lasted long enough to cause a change in the wildly bullish sentiment that prevailed last summer. That criteria has clearly been met.
The charts now show typical continuation patterns, which likely represent a pause in the long-term uptrend.
The bullishness is due to the positive monthly volume action, as the OBV has stayed positive for ten years. Also, typically demand for gold is highest in August, September, and October.
On a short-term basis, the bottom has not yet been confirmed, but the 127.2% Fibonacci target from the weekly flag formations projects a potential move in December Comex gold to $2,045. The 127.2% target for GLD is at $197.50.
This justifies more than one attempt to get long if we do get one more downside washout. Once a bottom is confirmed, there will be additional opportunities to buy.
How to Profit: The iShares Gold Trust (IAU) is less volatile than GLD and therefore is preferred for new positions. If you are not long IAU or GLD as previously recommended, go 50% long IAU at $15.66 and 50% long at $15.48, with a stop at $14.95 (risk of approx. 4%)
Portfolio Update: Investors should be 50% long SPDR Gold Trust (GLD) at $152.42 and 50% long at $150.28. Use a stop now at $149.65.
For the iShares Gold Trust (IAU), investors should be 50% long at $15.68 and 50% long at $15.42, with a stop at $14.43.
After taking an 8.9% profit early the year, our recent 50% longs in Newmont Mining (NEM) from $49.04 and 50% long from $48.20 were both stopped out at $45.62, as NEM hit a low of $42.95 last week.


