
MoneyShow's Tom Aspray has always believed that one should do one's own research and analysis, instead of relying on others, and below he shows an example of his own process.
The sharply higher opening Monday likely hit the “taper bears” pretty hard as especially those with bearish option positions had little opportunity to get out. The Spyder Trust (SPY) gapped 1% higher on the opening. Options like the SPY October 170 puts opened 35% lower than they closed on last Friday.
The market internals were strongly positive on the NYSE Composite and the NYSE Advance/Decline line now shows a bullish upward zig-zag formation, which is consistent with a new uptrend. Still many of the markets did close well below the day's highs suggesting the market may need a few days to digest its gains. Investors are likely to become even more skittish as we get closer to the FOMC announcement on Wednesday.
A correction in the key ETFs and the stronger stocks could take prices back to their rising 20-day EMAs, which is likely to set up a good buying opportunity. Before the summer started, I recommended that the best course of action would be to “summer proof” your portfolio and take a cautious approach to the markets during the summer markets. This included adjusting the maturity of your bond portfolio as well as preparing your portfolio for a 5-10% correction.
Overall, the stock market has held up much better than I expected while my forecasts for higher yields has indeed made it tough for bond holders. A review of what went right and wrong with the recommendations in the Charts In Play portfolio is a process that all investors and traders should follow if they want to improve their performance in the future.
Click to Enlarge
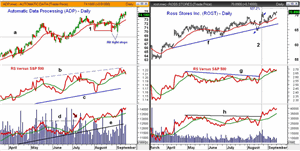
Chart Analysis: Automatic Data Processing (ADP) is a stock that has been in the model portfolio since November 2012.
- The original average entry price was at $55.54 and 50% was sold at $61.43 in February.
- This followed my normal practice of taking profits when a position reaches the initial target.
- However, ADP hit a high in May at $72 proving that I left quite a bit on the table.
- The decline in June reached a low of $67.28, which was just above the stop at $66.93.
- ADP made further new highs in July at $73.93, and I raised the stop to $68.82.
- My rationale for the stop placement is a good example of why it can be more difficult than many think.
- The August 1 low was $70.11 (line a), and I felt that this level could be broken but that it still would not change the major trend.
- ADP did make subsequent correction lows at $69.89 in late August and then a bit lower at $69.76 in early September.
- This likely cleared out many weak longs and set the stage for ADP to rally to new highs.
- The quarterly projected resistance is at $76.95, which is the next likely upside target.
- The daily relative performance shows a pattern of higher highs, line b, but has just dropped below its WMA.
- The OBV broke through resistance , line d, in July and has confirmed the new highs.
Ross Stores Inc. (ROST) was recommended late last month as while it was overbought based on the weekly starc band scan, the weekly relative performance analysis indicated it was a new market leader. Longs were established at $67.76.
- The August high at $70.86 was overcome on Monday with monthly projected pivot resistance at $73.85.
- The daily relative performance broke through its resistance, line g, in August.
- The Weekly RS line had been rising since last March.
- The breakout in prices (line 2) was confirmed by the surge in the daily OBV, which is still acting very positive.
- The weekly OBV (not shown) is also positive, so the multiple time frame OBV analysis is bullish.
- There is initial support now at $68.80 at the 20-day EMA and then at $67.59, which is the monthly pivot.
- The August low at $64.65 is the next major support level.
NEXT PAGE: Examples to Demonstrate the Process
|pagebreak|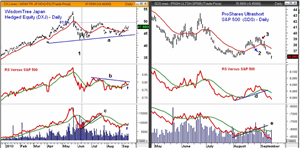
Click to Enlarge
On June 11, there were signs that the selling in the Nikkei 225, and therefore the Japan-focused ETFs, was overdone as important support had been reached. The WisdomTree Japan Total Dividend Index (DXJ) was one of my favorite ETF as its yen exposure was hedged.
- At the time (line 1), I recommended going 50% long at $44.54 and 50% long at $43.26, with a stop at $41.41, which had a risk of 5.7%.
- The low at $42.58 was made five days later, and by early July, DXJ had started to move higher.
- By then, the relative performance and on-balance volume (OBV) had moved above their WMAs and turned positive.
- DXJ rallied above the 50% retracement resistance at $48 on July 1.
- On the 17th, I raised the stop to $44.63, but in hindsight, I should have taken a partial profit as the 61.8% resistance was at $49.43.
- This resistance was slightly exceeded the following day and selling at, say $49 or better, would have meant a partial profit of over 11%.
- My bullish long outlook for Japan was the reason for not taking a partial profit, which is my normal strategy.
- As it turned out, I sold half at $46.10 and was stopped out of the rest at $44.63 for a 1.8% profit.
The ProShares Ultrashort S&P 500 (SDS) is a double inverse ETFs I often use when I see signs that the stock market may see a meaningful correction.
- In early August, there were signs from the technical studies that SDS was bottoming.
- The relative performance formed a short-term uptrend, line d, suggesting it was acting stronger than the S&P 500.
- A similar improvement was evident in the OBV (line e) but it took the 225-point drop in the Dow on August 15 to push it well above its WMA.
- Stocks declined and SDS rose for the next five days, which caused further short-term sell signals in the A/D indicators.
- Stocks then did manage to rebound but by August 23, I was looking for a rally to fail.
- The following Monday (point 2), the market internals were solidly negative by early afternoon, and
I tweeted to buy SDS at $37.88. - The next day, SDS gapped higher and hit a high of $39.33 on August 28.
- There, the rally stalled, and over the next few days, the OBV eventually dropped below its WMA.
- Therefore, before the opening on Sept. 4, I raised the stop to $37.93, or essentially breakeven, and it was hit that day.
- On Monday, SDS closed below $36 and the lows have been confirmed by the OBV and RS analysis.
What It Means: I focused on Automatic Data Processing (ADP) to give you an example of how often a stop just under what appears to be an important low can still be hit before the market continues its trend. For more on stops, you might find this trading lesson helpful.
Ross Stores Inc. (ROST) is a good example of how a weekly overbought reading can help one set up a strategy to buy on a good setback and I still like this stock.
I clearly should have taken some profits in WisdomTree Japan Total Dividend Index (DXJ), at least after it failed to overcome the 61.8% resistance.
The ProShares Ultrashort S&P 500 (SDS) trade example illustrates that one has to be very nimble in trading the leveraged ETFs. To have obtained a better entry, I would have needed to anticipate a change in trend without strong signals. As it was, the intra-day entry was well timed, and I took a proactive move to avoid a loss.
I hope you find these examples helpful, and as always, I appreciate your comments.
How to Profit: No New recommendation.
NEXT PAGE: The Charts in Play Portfolio
|pagebreak|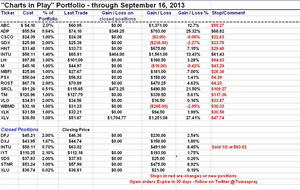
Click to Enlarge


