
Although healthcare has outpaced the overall market for more than two years now, MoneyShow’s Tom Aspray sees some yellow flags ahead for some stocks in this red-hot sector.
Stocks sagged to start off the new month, though the losses in the major averages were slight with the S&P 500 down 0.37% but the Russell 2000 was one of the weakest, down 1.07%. Only the Dow Jones Transportation bucked the decline, closing up 0.25%.
The market internals were much weaker than prices with just 871 advancing stocks while 2202 declined. This has caused further short-term divergences in both the Advance/Decline lines and the McClellan oscillator. Another day of equally negative market internals will trigger stronger daily sell signals.
The Eurozone markets are down sharply in early trading with the German Dax down over 1%. The US futures are also lower in early trading and the close today could help determine whether this is just a pullback or a more severe correction.
The healthcare sector has become the favorite of almost all analysts and there are some early warning signs for the Sector Select Health Care (XLV). Even though there are no sell signals for XLV, there are for several of its largest components.
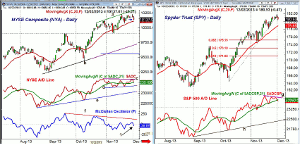
Click to Enlarge
Chart Analysis: The NYSE Composite (NYA) closed below the last five-day lows on Monday and not far above the 20-day EMA at 10,108. The close was below the doji low so a daily LCD sell signal was triggered.
- There is additional support at 10,000 and then the September high (dashed line) in the 9900 area. This is 2.3% below Monday’s close.
- This is the early November low, and if broken, then the daily uptrend, line b, is now in the 9730 area.
- The quarterly pivot (blue line) and more important support is at 9558.
- The NYSE Advance/Decline failed in November to exceed the October highs, line c, as it has diverged from prices (line a).
- The WMA is now being tested and a drop below support at line d would further weaken the technical outlook.
- There is stronger support for the A/D line at the uptrend, line e.
- The McClellan oscillator has formed lower highs since September, line f.
- It rallied to +44 on Friday which coincided with the previous high in November.
- The zero line (see arrow) was violated on Monday and a drop below -125 will be more negative.
- There is a band of resistance now in the 10,200-10,300 area.
The Spyder Trust (SPY) just avoided an LCD on Monday with the rising 20-day EMA at $178.85. The SPY is still up 9.7% from the October lows.
- The rising 20-day EMA is at $178.85 with further support at $177.98, which was the November 20 low.
- The 38.2% Fibonacci retracement support from the October low is at $175.15.
- The early October low is at $174.76 so this is an important level of support.
- The S&P 500 A/D line has dropped below its WMA after forming a slight negative divergence, line g.
- The A/D line has more important support at the September highs (dashed line) and then at the uptrend, line h.
- The daily OBV (not shown) has just closed below its WMA, which is flattening out.
- A weekly close below last week’s doji low at $180.37 will trigger a weekly LCD sell signal.
NEXT PAGE: Topping Healthcare Stocks
|pagebreak|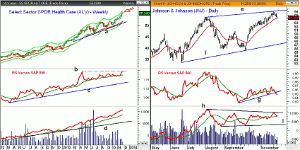
Click to Enlarge
The Select Sector SPDR Health Care (XLV) has been a favorite since May 2012 as it had broken out of a 12-year trading range. XLV closed last week just 1.2% below its weekly starc+ band.
- There is first support at $53.78 to $54.32 with monthly projected support at $53.18.
- On the weekly chart, there is more important support in the $52.16-$52.36 area.
- The weekly relative performance is above its WMA but has not yet moved above the April highs, line b.
- The RS line has major support at line c and the daily is still clearly positive.
- The weekly OBV has confirmed the new highs but is quite a ways above its rising WMA.
- There is further OBV support at line d.
- There is minor resistance at $55.71 with the quarterly R3 resistance at $57.15.
Johnson & Johnson (JNJ) makes up 12.4% of XLV and was one of the most overbought Dow stocks as it closed the month just 6% below its monthly starc+ band.
- The daily chart shows that it made a high last week of $95.99, line e, before turning lower.
- The 20-day EMA is now being tested with further support in the $92.28 to $93.58 area.
- The 38.2% Fibonacci retracement support is at $91.96 with the 50% support at $90.72.
- The relative performance has broken its uptrend, line g, and is below its flat WMA. It has been much weaker than prices.
- The weekly RS line (not shown) has formed a divergence from the August highs and has turned down after testing its declining WMA.
- The daily on-balance volume (OBV) did not make a new high in November, forming a negative divergence, line h.
- The rising WMA is now being tested with major OBV support at line i.
- The weekly OBV (not shown) did confirm the recent highs.
- There is a band of resistance now at $95-$96 with the quarterly R2 resistance at $97.82.
What It Means: Stocks are set to open lower but it is the close that will be more important. Stronger daily sell signals do look likely, which could take the market back to first good support, which for the Spyder Trust (SPY) is in the $175 area. This is 3% below current levels.
The Select Sector SPDR Health Care (XLV) looks especially vulnerable to profit-taking as its second largest holding, Pfizer Inc. (PFE), is also one of the Dow’s most overbought stocks. Other stocks in the ETF like Gilead Sciences (GILD), Bristol-Myers Squibb (BMY), and UnitedHealth Group (UNH) also appear to have completed daily top formations.
How to Profit: No new recommendation


