
Though a couple of these stocks are just below all-time highs, and their fundamentals show promise, the charts may be flashing some warning signs, writes MoneyShow.com contributor Kate Stalter.
Throughout the weak economy of the past few years, retailers have been, perhaps surprisingly, some of the market’s best price leaders.
That trend continues, although many of the best performers have sported sloppy price consolidations lately, and may be struggling to notch further gains.
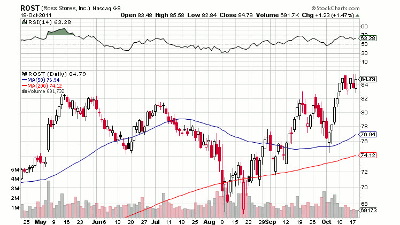
Ross Stores (ROST), which reports earnings a month from now, has been a solid performer from the S&P Consumer Discretionary sector.
The stock actually began rallying in December 2008, three months before the broader market went into an uptrend. Since then, Ross is up 217%, and continues to hold well above its ten-week moving average.
Click to Enlarge
Earnings are seen coming in at $1.16 per share, a year-over-year gain of 14%. Sales are expected to rise 8%, to $2.02 billion.
Both value and luxury retailers have prospered in the sluggish economy, and it’s clear on which side of that fence Ross lives. The stock’s price action is currently outpacing former momentum leaders from the luxury category, such as Coach (COH) and Tiffany (TIF), which are in the midst of sloppy, erratic price consolidations.
Ross, meanwhile, rallied to an all-time high of $85.67 on Monday. I’m optimistic about the stock’s medium- and longer-term prospects, but its current chart gives me some reason to hold back, for the moment.
Its most recent price consolidation was the latest in a long series of pullbacks as the stock has trended higher. On August 18, Ross’ price undercut the previous base’s intermediate low of $67.45, from March. However, the recent sloppy trade—which was in keeping with volatile market action—could be a sign of investor indecision.
For now, it’s trading nicely above its last technical entry point, at around $83. It’s still in a buy range, but as with just about everything else in this market, it wouldn’t be surprising to see another pullback if the indices show another decline.
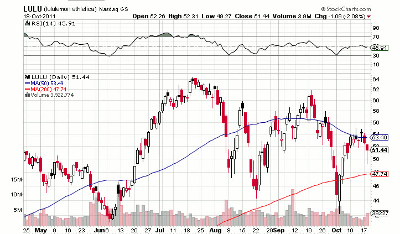
Another potentially long-in-the-tooth retail momentum leader is Lululemon Athletica (LULU), which is nestled between its 40-week moving average as a floor, and its ten-week as a ceiling.
Here, too, the most recent area of price consolidation has been choppy and volatile, a characteristic that’s common these days in many stocks, even larger caps.
Click to Enlarge
Analysts continue to see plenty of upside for the company, with third-quarter earnings estimates pegged at 25 cents a share, which would be a year-over-year gain of 39%. The yoga-clothing retailer has stretched beyond estimates in each of the past four quarters, so the market is likely expecting another beat. Revenue is seen climbing 34%, to $235 million.
Buyers and sellers have played tug-of-war on this stock, though sellers have ultimately won, sending the stock down 22% from its July 20 all-time high of $64.49.
There’s a way to interpret the chart as a double-bottom pattern marred by fairly wide weekly price swings. That type of action frequently precedes a further downside move, although the decline can come on the heels of a rally attempt.
Longer-term, the story and the fundamentals remain intact. The company has plans to increase store openings, and its offerings have proven to be popular in cities where it’s gone. That’s a plus.
However, many analysts expect competition in the market for women’s athletic clothing to intensify. So over time, Lululemon may have to fight harder for the levels of growth it’s been enjoying.
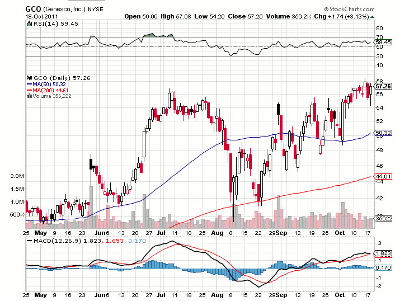
Finally, Genesco (GCO) is a name that was not among the ranks of 2009 and 2010 momentum leaders, but is emerging. The corporate name itself is not well known, but it owns familiar retail brands such as Lids, Johnston & Murphy, and Journeys.
Like many other stocks, Genesco began some wide-and-loose trade in August, as the market grew more erratic. The stock cleared resistance above $57 recently, but has had trouble gaining any traction above that level.
The fundamentals of this company have improved considerably in the past four quarters. Analysts are eyeing earnings growth of 38% in fiscal 2012, and another 18% in 2013.
Volume trends in the stock have been encouraging, with weekly upside trade lately coming at better levels than downside. Genesco is a mid-cap that trades about 470,000 shares per day, so there’s a decent amount of liquidity.
Click to Enlarge
While there are some positive signals from the chart, Genesco is another stock that should be treated carefully. It’s within a technical buy range, but recent erratic trade and general market uncertainty are factors that diminish the chart’s promise, at this moment.
All three of these stocks may go on to notch gains despite some sloppy technical action, but investors should be aware of some potential negatives if they decide to go long, and be ready to cut losses quickly.
Related Reading:
Capture Price Growth with These 6 Stocks
5 Growth Names if Market Rally Holds
Real World Example of Bear Call Spread


