
The debt ceiling is widely seen as more important than the government shutdown, but as the two events get closer together, MoneyShow's Tom Aspray examines the technical evidence for signs of potentially deeper corrections ahead.
As we ended last week with no end in sight for the government shutdown, the economists were weighing in on its potential impact. In a recent WSJ article, the conclusion was that "The furloughs are likely to knock 0.1 to 0.2 percentage point off the annualized rate of fourth-quarter economic growth for each week that it lasts."
There are a wide range of views as some feel that the chances of a big economic shock and severe market decline have increased significantly while others worry about the complacency. Others are not expecting such a significant impact as they feel that the markets have already priced it in and a "shutdown for a couple of weeks would be unlikely to be detrimental."
There is more agreement regarding the impact of a failure to raise the debt ceiling but most feel that the adults won't let that happen. Global monetary authorities are also voicing their opinions as the IMF's Christine Lagarde expressed her concerns over the debt ceiling while the ECB's Mario Draghi is concerned over the impact of a prolonged government shutdown.
In the past two years, there have been three example of politically induced panic selling. The first started in late July and early August of 2011 as the debt ceiling debate ended in a stalemate. This was a decline that was difficult to withstand as the S&P fell from an early July high of 1356 to an October low of 1074. This was a drop of 20.8% from high to low. Soon after the October low, there were clear signs from the market internals that a low was in place.
The markets also reacted poorly to the re-election of President Obama as the Dow Industrials lost 800 points in eight days. The next month, stocks dropped 3.5% at the end of December in reaction to the fiscal cliff stalemate. Before this decline, the A/D line broke out to the upside indicating a pullback would be a buying opportunity.
I would not be surprised to see a 3-5% decline if the government shutdown persists for another week or so. A failure to raise the debt ceiling before the deadline is likely to have a much more severe impact on the global equity markets.
Click to Enlarge
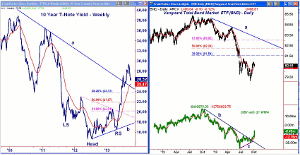
There are no signs of panic in the bond market as yields have declined in an orderly fashion. The weekly chart of the 10-year T-note yield shows the recent top in yields as first support in the 2.545% to 2.636% has been reached. The 38.2% Fibonacci retracement support is at 2.372% with the 50% at 2.197%. This is the likely downside target zone for the fourth quarter.
The daily chart of the Vanguard Total Bond Market ETF (BND) does show a completed bottom formation on the daily chart. From the late April highs to the early September low, BND lost over 6%.
The daily on-balance volume (OBV) formed a bullish divergence, line c, at the lows. The bottom was confirmed by the move through the downtrend, line b, and the July high. The next level to watch is the 38.2% Fibonacci retracement resistance at $81.54 and then the 50% at $82.54. This decline in yields should be an opportunity to shorten the maturity of your bond holdings and reduce your exposure to the long end of the bond market.
Click to Enlarge
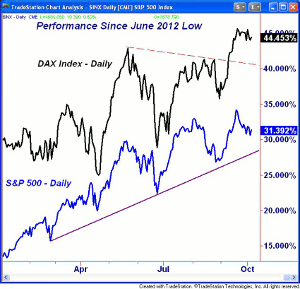
The Eurozone markets, like the Dax Index have not yet been hit with heavy selling. It is still up well over 44% since the June 2012 lows and is just 2% below its recent highs. The % change chart of the S&P 500 shows that it is now up 31%, which is down from last month's high of 34.5%.
NEXT PAGE: What to Watch
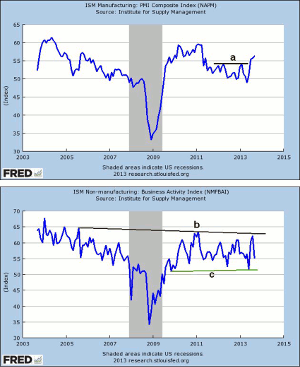
|pagebreak|The data early last week on the manufacturing sector was quite positive as both the Chicago PMI and the Dallas Fed Manufacturing Survey were much stronger than expected. This was followed on Tuesday by a flat reading in the PMI Manufacturing Index.
The stock market was encouraged by Tuesday's ISM Manufacturing Index, which rose to 56.2. The chart below shows that the trend line resistance at line a, has been overcome with the September reading. This was the best number since early in the economic recovery.
Click to Enlarge
The ADP Employment Report was a bit weaker than expected last Wednesday and the selling in the stock market increased after Thursday's release of the ISM Non-Manufacturing Index. It dropped from 58.4 the prior month to 54.4 in September. The chart above shows that it is still locked within a broad trading range, lines b and c. A breakout of this range is likely to be significant.
With the government shutdown, the economic releases are going to be limited as the monthly jobs report due last Friday has been postponed indefinitely. Of course, with less information to analyze, a tapering decision by the Fed seems less likely this month.
On the normal schedule, this week we have International Trade on Tuesday, with jobless claims and Import and Export Prices on Thursday. Scheduled for Friday release is the Producer Price Index and Retail Sales. The earnings season starts on Tuesday with earnings from Alcoa Inc. (AA), and many companies are reducing expectations.
What to Watch
It was a choppy week in the stock market, though despite the uncertainty, the major averages held up surprisingly well as Friday's rally helped. The daily technical studies did deteriorate last week but many turned higher on Friday. They are still well above the important support at the late August lows. The weekly studies have not given any major sell signals, which I would expect to occur before the market is going to see a wave of heavy panic selling.
Most are now watching the support in the S&P 500 in the 1670 area. A decisive break of this level will make the next downside targets in the 1650 area. In August, the S&P traded as low as 1627.
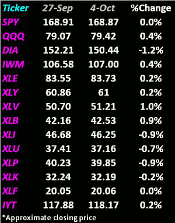
Of the four major market-tracking ETFs that I follow all, except the SPDR Dow Industrials (DIA), will close the first week above their quarterly pivots that I discussed in last week's trading lesson. This is a positive signs for the 4th quarter. As I noted in that review, there are several key sectors that should be avoided.
In last week's column, I pointed out that the number of S&P 500 stocks above their 50-day MAs had topped out, and it has now declined further. On September 18, 78.6% of the S&P 500 stocks were above their 50-day MA but now only 49.8% are. On the last two market lows, the percentage dropped to the 26-30% level before it bottomed
Several of the most overbought Dow stocks I discussed last week have pulled back from their highs, and one of my favorites has already reached my initial buying zone.
There is very little change in the sentiment last week, as the number of bullish individual investors according to AAII rose slightly to 37.8 while the number of bears was unchanged. The financial newsletter writers were also more positive as the bullish percentage rose to 46.4% from 44.3%.
Click to Enlarge
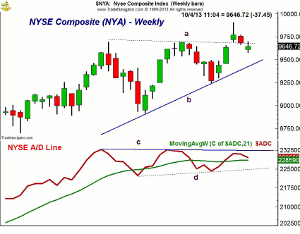
The weekly chart of the NYSE Composite shows the lower closes over the past two weeks after the high at 9906. It is down 2.6% from the highs with the quarterly pivot at 9558. The monthly projected pivot support is at 9309 or 3.5% below current levels.
The breakout from the weekly flag formation (lines a and b) suggested that the uptrend had resumed but a higher close this week is needed to support this view. The uptrend is now in the 9450 area.
NEXT PAGE: Stocks
|pagebreak|The weekly NYSE Advance/Decline line did not make a new high with prices as it fell well below the previous highs at line c. The A/D line has turned lower and is still above its WMA. A drop below the weekly support at line d would confirm the negative divergence.
The McClellan oscillator (not shown) started a short-term downtrend on September 27 and hit a low of -86 last Thursday. It turned up slightly on Friday, and a move above the 40 level would be positive.
Click to Enlarge
There is first resistance now in the 9700-9750 area and then at 9860.
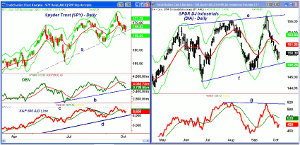
S&P 500
The Spyder Trust (SPY) tested the long-term uptrend, line a, that goes back to the late 2012 lows. It closed the week above it and also above the quarterly pivot at $167.77. The daily starc- band is at $165.50 with the monthly projected pivot support at $163.27.
There is short-term resistance now at $169.50-$170 with the daily starc+ band at $171.77.
The daily on-balance volume (OBV) did make convincing new highs with prices last week before it dropped below its WMA. The next important support is at the August lows and the long-term uptrend, line b.
The daily S&P 500 A/D line was the only one of the four major A/D lines to make a new high last month as it surpassed the prior highs at line c. The A/D line is now below its slightly declining WMA but is still well above more important support at line d.
Click to Enlarge
Dow Industrials
The SPDR Dow Industrials (DIA) continues to lag the other averages as it closed barely above the $150 level but below the corrected quarterly pivot at $152.02. The daily starc- band was tested last Thursday and is now at $148.29. The 20-day EMA is now at $151.95 with the daily starc+ band at $153.66.
The Dow Industrials A/D line did not confirm the new price high at $159.06, line g. The A/D line has turned up and has held well above the August lows. There is initial resistance now at $153.50-$154 with the daily starc+ band above $155.
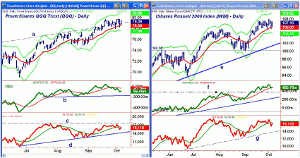
Nasdaq-100
The PowerShares QQQ Trust (QQQ) closed the week higher again last week. It held the rising 20-day EMA all last week, which is now at $78.59. The daily starc- band is at $77.60.
Once above the recent high at $79.76, the daily starc+ band is at $80.89. The weekly starc+ band is at $81.60 with the quarterly R1 resistance at $82.48.
The OBV did make a new high in September but is currently below its now declining WMA. The OBV has important support at line b. The daily Nasdaq-100 A/D line turned up Friday but is still below its WMA. The A/D line has not moved above the July highs and has not yet confirmed the price action.
The weekly and daily relative performance analysis (not shown) is still acting very strong as both are rising sharply as it is outperforming the S&P 500.
Click to Enlarge
Russell 2000
The iShares Russell 2000 Index (IWM) also was able to close the week higher and not far below the all-time high at $107.93. The daily starc+ band is at $109.55 with the weekly at $110.27. The quarterly R1 is at $111.37.
The daily OBV made a new high last week and the weekly OBV (not shown) above its WMA. It is also close to new all-time highs and both OBVs are above their rising WMAs therefore the multiple time frame OBV analysis is bullish.
The Russell 2000 A/D line is still below the July highs but has turned up. It is below its WMA but is well above the long-term uptrend, line g.
The daily and weekly relative performance analysis continues to indicate that IWM is a market-leading sector.
There is initial support at the 20-day EMA at $106 with the quarterly pivot at $104.41, which is also important chart support.
NEXT PAGE: Sector Focus, Commodities, and Tom's Outlook
|pagebreak|Sector Focus
The iShares Dow Jones Transportation (IYT) held the quarterly pivot last week and closed higher. It is still acting better than the Dow Industrials, which is a positive sign for the economy. A close above $119.50 should signal that the pullback is over with the all-time high at $121.
The weekly studies are positive (not shown) but the daily OBV closed the week just below its flat WMA.
Five of the 14 ETFs in the weekly performance table closed lower last week as the Sector Select SPDR Consumer Staples (XLP) was down around 1% and closed the week below its quarterly pivot. The Sector Select SPDR Industrials (XLI) recorded a similar loss.
Click to Enlarge
The Sector Select SPDR Health Care (XLV) continues to act well as it was the strongest, gaining 1%, followed by similar gains in the Sector Select SPDR materials (XLB). The Sector Select SPDR Consumer Discretionary (XLY) and the Sector Select SPDR Energy (XLE) were just slightly higher.
The Sector Select SPDR Financials (XLF) had nice gains on Friday but closed the week flat.
Dollar Index: The dollar index was hit hard early in the week as the futures made a new correction low at $79.72 before rebounding at the end of the week. The daily and weekly analysis is still negative with major support in the 78 area.
Crude Oil
Crude oil rebounded last week but the December contract did close slightly below its quarterly pivot level at $103.78. The OBV is still positive, and it will take a break below $100 to weaken the current uptrend.
Precious Metals
The Spyder Gold Trust (GLD) and the Market Vectors Gold Miners (GDX) failed to rally with the government shutdown as both closed the week lower. This is a disheartening sign for the gold bulls. The technical outlook for the miners is still better but they need to rally soon in order to complete a bottom formation.
The Week Ahead
The stock market bears still seem to be the most vocal, but the way the market acted, I would be nervous if I was short going into the weekend. If the government reopens with some hope that the debt ceiling will be raised, the market could blast off to the upside.
I think the close this week will be important as a sharply lower close will turn the focus back on the downside. This is not the time to ignore your portfolio, so check your positions and adjust your stop as I did for the Charts in Pay portfolio. Also, it is a good idea to review any losing trades as this process can help you improve in the future.
The emerging markets are now back to first and are close to giving new buy signals. I will look to recommend the Vanguard FTSE Emerging Markets ETF (VWO) for those who are not in, per the dollar cost averaging approach I discussed previously.
Lastly, have your stops in, in case it gets even crazier and don't second guess them while the market is open.
- Don't forget to read Tom's latest Trading Lesson, How to Invest in the 4th Quarter.


