The relief rally on Wall Street continued Friday, fueled by hopes that the insanity in Washington will end soon, as MoneyShow's Tom Aspray takes a technical look at the damage to the GOP's brand in the interim.
Fear, disbelief, and disgust were some of key sentiments expressed by the public and investors last week. Early in the week, the selling reached panic levels such as those last seen in December of 2012. As we ended the week, there were hopes that the debt ceiling and budget compromise would be reached soon, but at what cost?
By the end of the week, the Republicans realized that their insistence on abolishing the healthcare plan was not working, but as is often the case, there has been quite a bit of damage and unneeded suffering in the interim. It was particularly offensive to many that Congress was still getting paid.
It seems like the Tea Party faction is bound and determined to drive out those good Republicans like Bill Bennett and Richard Lugar who did not get their views of the global economy from a crackerjack box. I hope that if other veteran Republican senators are driven out by the Tea Party in the primaries that they will run as Independents as they are an asset to our country.
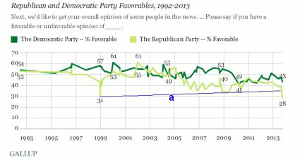
Using financial market criteria, the Republican Party has been in a bear market since their favorable rating peaked at 61 in 2002. The Gallup chart shows that it has dropped 15% just this year and has violated support at line a. It is now even below the reading of 31% favorable from 1999.
Most investors look at the Republicans as being more business friendly and clearly the business interests were not pleased with Obama's first term as the financial sector contributed heavily to the Romney campaign.
However, according to S&P Capital IQ, the "S&P 500 has rallied an average of 12.1% per year since 1901 when Democrats occupy the White House, compared with just 5.1% for the GOP." Of course, the Great Depression did skew the numbers. Since 1949, the GDP growth has been 4.2% under Democratic presidents versus just 2.6% when there was a Republican president.
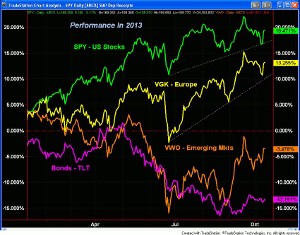
Despite the recent setback, 2013 has clearly been a year for being in the developed world's stock markets. The Spyder Trust (SPY) is up over 19%, while the Vanguard FTSE Europe ETF (VGK) is up over 13%, with the German DAX Index up over 14%. It held up well last week as it was up around 0.7%.
The emerging markets, as represented by the Vanguard FTSE Emerging Markets ETF (VWO), are down just over 3% for the year. The technical view, discussed last week, suggests they are in the process of bottoming and many were up sharply last Thursday.
The spike in short term T-bill rates got the market's attention and the iShares Barclay 20+ Year Treasury (TLT) is still having a rough year, down over 13%.
The lack of the economic reports, like the monthly jobs report, makes it unlikely that the Federal Reserve will cut back on their bond buying this month or next. Though jobless claims were up last week, the longer-term improvement in many of the economic measures suggests that the economy may be stronger than most think.
NEXT PAGE: What to Watch
|pagebreak|
The focus now will be on the earnings reports as expectations have been lowered in the last month. Friday's report from JPMorgan Chase & Co. (JPM) that they lost $380 million in the third quarter compared with a profit of $5.71 billion last year was taken quite well by the market as their stock was down just slightly in early trading.
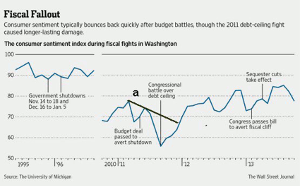
The consumer sentiment has taken a beating with the debt ceiling, though last Friday's mid-month reading of 75.2 was just down a bit from the end of September's 77.5 reading.
As the chart from the Wall Street Journal indicates, confidence bounced back pretty quickly after the last Republican-led shutdown in 1995-1996. Confidence formed lower highs in 2011, line a, prior to the 2011 debt ceiling crisis. This pushed the sentiment to low levels and the downtrend was not overcome until late 2011. It took until early 2012 before it moved back above the 70 level.
Other readings, like Retail Sales, are delayed due to the shutdown. The regular schedule this week has the Empire State Manufacturing Survey on Tuesday that would normally be followed by the Producer Price Index and Housing Market Index on Wednesday.
On the calendar for Thursday are Housing Starts, Industrial Production, and the Philadelphia Fed Survey, followed by the Leading Indicators from the Conference Board on Friday.
What to Watch
As it turned out, the bounce on Friday, October 4, was a good fake out as it just slightly relieved the oversold status of some of the daily studies, setting the stage for much heavier selling at the start of last week. The panic selling came in without the weekly sell signals I thought were needed last week.
These panic selloffs, unfortunately, are becoming more common, and think the best way to deal with them is to use a number-based strategy like I suggested last Friday.
The impressive turnaround last Thursday caught those on the short side by surprise as profits from the day before quickly evaporated. I have been saying for sometime that while the short-term outlook for the major averages did point lower, there were many stocks that were bucking that trend or forming good bases.
This analysis was included in my recent trading lesson on How to Invest in the 4th Quarter as we are entering the best time to be invested in stocks.
The strength at the end of the week has turned the short-term outlook back to positive but further gains are needed in order to signal that a major new uptrend is underway. It will be important that the market internals as viewed through the A/D lines start to outperform the indices.
As I expected last time a drop in the S&P 500 below the support in the 1670 area made the next downside targets in the 1650 area. The low for the week was at 1646. This now makes the August low at 1627 much more important support.
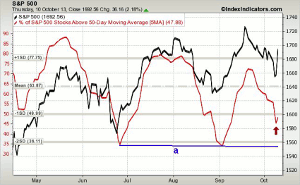
Last week, I noted that the number of S&P 500 stocks above their 50-day MAs had declined further and dropped below the 50 level. Last week came close to the 35 level, but as the chart shows, the five-day MA (in red) has now turned up after dropping almost two standard deviations below the mean. The MA held above the prior two lows, line a, which is an encouraging sign
Still not much change in the sentiment numbers as the number of bullish individual investors, according to AAII, rose to 41.2% from 37.8% as the poll was taken last Thursday. The financial newsletter writers showed little change with only 20.8% bearish. This is not in agreement with the views espoused by many of the media analysts as many seemed more bearish.
NEXT PAGE: Stocks
|pagebreak|
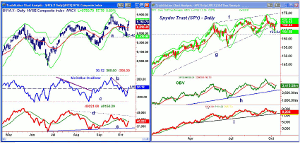
The daily chart of the NYSE Composite shows that the lower daily starc- band and the support at 9415, line a, were tested at last Wednesday's lows. The Friday close was well above the prior eight-day highs. There is next resistance at 9858-9906 with the weekly starc+ band now at 10,046.
As the weekly chart suggested last time, the breakout from the weekly flag formation suggested that the uptrend had resumed and this week's is consistent with this view.
The McClellan oscillator dropped to -180 last week but then rallied to close back above the zero line. The downtrend line b, has been broken, which is similar to what happened in August. On a pullback this week it could drop back to -50 but should hold above the prior lows.
The daily NYSE Advance/Decline line has turned up after holding above the support at line e. It now needs to move through its downtrend, line d, and surpass both the July and September highs.
S&P 500
The Spyder Trust (SPY) briefly broke the uptrend from the late 2012 lows and is closing the week well above the quarterly pivot at $167.77. The daily starc- band was tested last week but the low at $164.53 was well above the monthly projected pivot support at $163.27.
There is next resistance at $172-$173.60, which was the previous high. The upper trend line (line f) is now at $174.22 with the weekly starc+ band at $175.77.
The daily on-balance volume (OBV) has moved back above its WMA after holding above the uptrend, line h. It closed the week barely above its WMA, which is now flattening out.
The daily S&P 500 A/D line also turned up nicely last week after testing the uptrend, line i, that goes back to the April lows. The S&P A/D line was the only one that confirmed the recent highs, and it is now back above its WMA
The quarterly pivot and first support is now in the $167.77 area.
Dow Industrials
The SPDR Dow Industrials (DIA) was under heavy selling pressure early in the week as the quarterly S1 support at $146.97 was tested. The quarterly pivot was tested on Friday with further resistance at $153.54. The quarterly R1 resistance and previous highs are at $156.66.
The Dow Industrials A/D line (not shown) has turned up as it held above the August lows. The A/D line is still below its WMA
Nasdaq-100
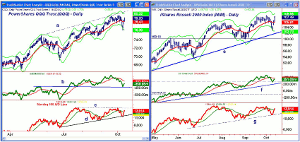
The PowerShares QQQ Trust (QQQ) dropped below the daily starc- band and also the quarterly pivot at $76.92 on Wednesday but closed well above it. The continuation on the upside, Friday, has taken the QQQ back above the $79 level and the 20-day EMA.
The daily starc+ band is at $80.32 with trend line resistance at $80.65. The weekly starc+ band is at $82.21.
The OBV did confirm the recent highs and has bounced from the support at line b. It is still well below its declining WMA.
The Nasdaq 100 A/D line tested its uptrend, line d, last week but closed back above its WMA. A breakout above the key resistance at line c is possible this week and that would be very bullish as it would confirm the price action.
Russell 2000
The iShares Russell 2000 Index (IWM) was also hit with quite heavy selling early in the week as the daily starc+ band was exceeded. IWM closed below the quarterly pivot at $104.41 on Wednesday. With the strong rally, IWM closed just below the all-time highs at $107.93. The quarterly R1 is at $111.37.
The daily OBV was able to hold well above the support at line h and tested the support from early August (dashed line) The daily OBV is still below its WMA while the weekly (not shown) closed last week at new highs, which is quite bullish. The multiple time frame OBV analysis is currently mixed.
The Russell 2000 A/D line has turned up strongly from support at line g and closed the week back above its WMA.
The daily and weekly relative performance analysis (not shown) is still positive as IWM is a market-leading sector.
There is initial support at $105.80 and the 20-day EMA.
NEXT PAGE: Sector Focus, Commodities, and Tom's Outlook
|pagebreak|
Sector Focus
The iShares Dow Jones Transportation (IYT) managed to close the week higher and back above the quarterly pivot at $116.73, which was violated during the week. The weekly technical studies are solidly positive as both the relative performance and OBV are above their WMAs.
The daily studies have turned up but have not yet turned positive. There is next resistance at $119.48 with further at $121. The weekly starc+ band is just above $124.
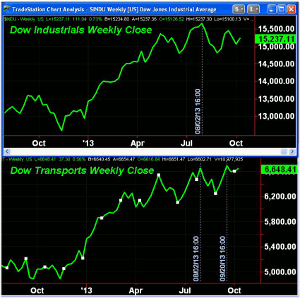
The Dow Industrials outperformed the Dow Transports last week and the weekly close only chart shows that both made new highs in early August. The Dow Transports made another new high in September, and even though the Industrials have not matched those highs, the Dow Theory is still positive. It would take a weekly close in the Dow Industrials below 14,760 to suggest that a top was in place.
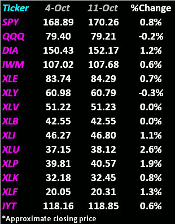
The powerful week-end gains pushed all except four of the monitored ETFs into positive territory for the week. The Select SPDR Consumer Staples (XLK) and Select SPDR Utilities (XLU), which had been lagging for the past few weeks were the best performers, up 1.7% and 2.5% respectively.
The Sector Select SPDR Industrials (XLI) and the beaten down Select SPDR Financials (XLF) were up 1% on the week.
Most of the sector ETFs have closed back above their 50-day MAs, which were tested last week. All are still below their most recent highs, so it will be important to see which will make new rally highs first.
For monitoring the ETFs during the rest of the quarter, I suggest you keep an eye on the quarterly pivot table and how the weekly closes relate to the ETF's quarterly pivots. The table can be found here.
Dollar Index: The dollar index made new correction lows on October 3 but has since rallied nicely. The daily technical outlook has improved but is still negative.
Crude Oil
Crude oil closed down $1.60 per barrel for the week. It is still holding well above the 50% retracement support at $100.35. The weekly analysis for crude oil is still positive and the energy stocks rallied sharply late in the week.
Precious Metals
The Spyder Gold Trust (GLD) and the Market Vectors Gold Miners (GDX) had another rough week as GLD was down 3.3% for the week. Still, a negative technical outlook and a test of the June lows is possible over the next few weeks.
The Week Ahead
Stocks did drop significantly early in the week, which enticed more to enter the short side of the market before it blasted off to the upside. Those on the short side were hurt by Thursday's sharply higher opening. I doubt many, myself included, thought we would see the Dow Industrials close higher for the week. The 400+ gain was indeed impressive. I still favor the technology sector as our buying zone was hit on Wednesday.
Last week, I thought the weekly close would be important as a sharply lower close could have generated heavier sell signals. Last week's action has clearly stabilized the market. Though the government may not reopen for a bit, it seems as though the debt ceiling will be raised before the deadline. This takes considerable pressure off the market.
I still think it is not the time to be complacent about your portfolio, and I adjusted the stops further in the Charts in Pay portfolio last week. Unfortunately, our positions in the homebuilders were stopped out, but I will watch for new buy signals as I think they will be higher by year end.
I would stick with a dollar cost averaging strategy in the Vanguard FTSE Emerging Markets ETF (VWO), and I focused on the emerging markets last week.
The energy stocks finished the week strong, and I think they are Still a Good Portfolio Bet. I would look for a pullback next week and buy points on retests of the 20-day EMA.
Don't forget to read Tom's latest Trading Lesson, How to Invest in the 4th Quarter.
Editor's Note: I hope the markets continue to treat you well over the next two weeks as I will be on vacation. The next Week Ahead column will be published on November 1.

