

With an energized tech sector catching a ride with the broad market surge, Scott Redler of T3 Trading Group checks whether this stock can return to its IPO price.
As you approach stocks, and especially recent IPOs, it doesn’t matter about the name or the hype. They all need to prove themselves. Most IPOs come with considerable hype; part of the job for an underwriting syndicate is to generate buzz. Some of the biggest winners come from recent IPOs, but some opportunities are cleaner than others. Some take a year or two to prove themselves and have to overcome several obstacles along the way.
The social networking arena has been one of the biggest obstacle courses out there with many pot holes. The sector, by nature, is highly speculative and polarizing among commentators. Many people use social networks, but the question has always been: what is the business model? The best-in-breed social stock has been LinkedIn (LNKD), which was a highly successful IPO from the get-go that has also seen beautiful accumulation pattern over almost two years.
If you look at that chart, there was a spot to accumulate a small feeler position as the pattern built, and then there was a spot to potentially add when it broke out above $124-127. Based on its bullish price action, I’ve been pounding the table on this stock for about a year, including frequent mentions on RealMoney. I took a call spread into the most recent earnings report, and my only regret on that trade was limiting my upside.
The question now is: can Facebook (FB) go on a similar run to its cousin LNKD? Facebook’s road has been much rockier than LinkedIn’s, but has the stock been public long enough to sufficiently work through its issues and potentially become a longer-term winner?
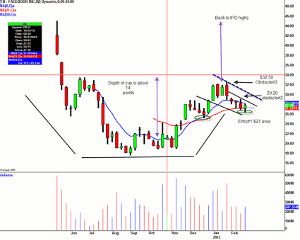
There have been some opportunities to time trades, both long and short, in FB since its IPO, but only if you ignored the hype and traded the stock purely based on the price action. In my 2013 predictions, I stated my opinion that FB was in the latter stages of a bullish cup-and-handle pattern and could see $32-34 this year. I didn’t expect the full move to happen by the end of January, but sometimes a plan comes to fruition more quickly than expected.
If you missed that move and want to be long FB, I believe now is the time to see if this pull back is buyable. If FB starts to work back to the upside, then you could perhaps add to your position at strategic levels. I prefer to use a tier system, adjusting size in the position at key technical points, rather than jumping “all in” at one “make-or-break” spot.
NEXT PAGE: Details of the Trade
|pagebreak|There are a lot of obstacles and naysayers in the path of FB, but I feel like that somewhat negative sentiment can help fuel a rally.
The first buy signal for FB came on Friday when the stock perked up through the $27 area. If you missed it, in my opinion there could be more entries/tactics, so don’t worry. If FB breaks above $29.10 and holds above it, showing commitment, that would be an area that I could look to add. Holding that level would show that some are willing to buy higher, and there could be more institutional involvement. The real trade for more macro players is above $32.50ish, but I don’t want you to wait until then to be involved. I’d rather build a position gradually based on composure than just enter in front of macro resistance.
There is a more macro cup-and-handle type pattern building in FB, although it is a little bit sloppy. Patterns do not trigger with 100% probability, or even close to it, but they are simply a roadmap that technical traders can use to judge potential entries and exits. However, if the pattern does trigger and show commitment at key levels, the measured move could ultimately take FB back to where the botched IPO started trading—the $38-42 range. Because of the length of time it took to build this pattern, it will take time to play out. I believe that using a tier system to measure commitment as FB overcomes obstacles on the chart will help manage risk and keep you involved in the trade.
Click to Enlarge
Last year, this chart looked like it was getting ready for better prices but failed when it broke $30.55. I got stopped out of a trade there, and in the process saved about 18 points of pain. Always honor stops. For this current trade set-up, you could look to put a stop in place at $26. That scenario creates a defined and attractive risk-reward parameter for the trade, which is something we always look to create. If we take out and close below that recent higher low, in my book it would nullify the recent constructive action.
In an IPO market that has many obstacles and pot holes, like we have seen with stocks like Zynga (ZNGA) and Groupon (GRPN), it pays to have a road map to figure out how to maneuver around them.
*Disclosures: Scott Redler is long BAC, FB, F, YHOO, NKE, WMT. Short SPY.
By Scott Redler, Chief Strategic Officer, T3 Trading Group


