
Copper futures and stocks have been falling fast, but with the charts showing no positive signals, now is not the time to go bargain hunting. Here’s how to know when the time is right.
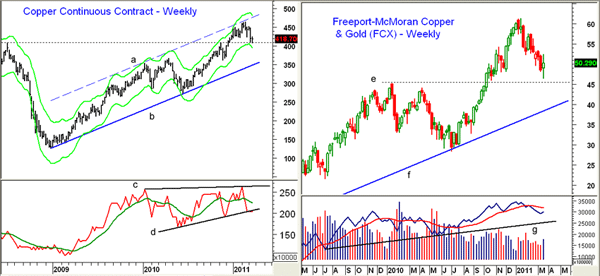
Much has been made recently over the sharp decline in copper prices as the futures price topped at 464 in December and has now dropped back towards the 400 level. Some analysts have interpreted this as a sign of a failing economic recovery, and the weaker-than-expected housing starts data has also increased the bearish sentiment. However, despite the 15% drop, the longer-term charts suggest that the major uptrend for copper prices—and the economic recovery—is still intact.
The action in the copper futures is consistent with my outlook for Freeport-McMoran Copper & Gold (FCX). On January 25, FCX closed at $53.22 and I was looking for a decline to the $45 to $49 area (adjusted for two-for-one split). With FCX hitting a low of $46.20 last week, is it time for action, and what about other copper stocks?
Click to Enlarge
Chart Analysis: The recent decline in copper prices does not look that severe on the weekly copper futures chart, as it shows a well-defined trading channel (lines a and b) with the upper boundaries tested in late 2010.
- Copper prices have reached support from the 2008 highs at 408 and are not far above the starc- bands*, which are at 395. This suggests that prices are reaching a higher-risk area to sell and a lower-risk area to buy
- There is key support at the November lows in the 360 area and a decisive break of this level would seriously weaken the major trend.
- The weekly on-balance volume (OBV), as well as the monthly OBV (not shown), both made new highs with prices. This is bullish for the major trend. The weekly OBV has now reached support at line d
*Read Buy, Sell, or Wait: A Way to Decide for more on trading with starc bands
Freeport-McMoran Copper & Gold (FCX) has declined about 24% from the January 15 highs at $61.34. Those who have invested in FCX over the years are likely not surprised by the severity of the decline, but I am sure many have sold their long positions in the past month.
- The 50% support level, calculated from last summer’s lows, is just above $45, and this also corresponds to the December 2009 highs
- The major 38.2% retracement support from the December 2008 lows at $7.85 is at $41, which also corresponds to the long-term uptrend, line b
- The weekly OBV did confirm the recent price highs before dropping back below its weighted moving average (WMA). It is now trying to turn up and is holding trend line support at line f. The daily OBV has not yet completed a bottom formation
- There is first chart resistance at $53.50 with much stronger resistance in the $56.40 to $57.60 area
Click to Enlarge
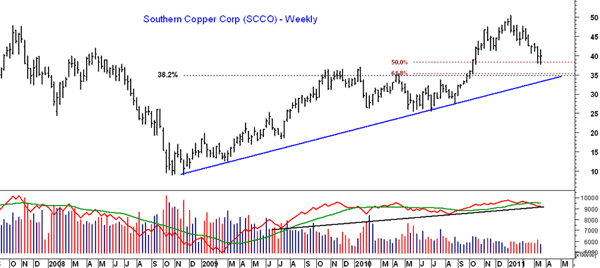
Southern Copper Corporation (SCCO) is more of a pure copper play as it mines and refines copper in Peru, Chile, and Mexico. It peaked on January 3 at $50.35 and closed on Wednesday (Mar. 16) 20.7% below these highs. The long-term uptrend on the weekly chart (line a) is still clearly intact
- The 50% retracement support from the 2010 lows at $38.30 was slightly violated this week. The major 38.2% support and the short-term 61.8% support are converging in the $34.90-$35 area
- The weekly OBV is now testing its rising 21-period weighted moving average but did confirm the recent highs. The daily OBV is below its WMA and declining, suggesting a short-term low is not yet in place
- There is initial chart and retracement resistance now at $42.70-$43.14 with more important at $45.70
What It Means: The decline in copper prices and the key copper stocks has reversed the overly bullish outlook from late last year. Clearly, many weak long positions in the copper stocks have likely been stopped out. With no positive signals from the daily studies, it is too early to confirm that FCX or SCCO have bottomed.
Typically, if copper futures prices bottom around 400, I would look for a rebound back to the 435 area before prices set back once more. I would not be surprised to see a formation of a triangle on the weekly chart. I am not expecting a protracted consolidation period like the one that developed in 2009-2010. Nevertheless, a drop to the key converging support levels would be a good risk/reward opportunity for new long positions in FCX and SCCO.
How to Profit: Technically, once FCX and SCCO complete their bottom formations on the daily charts, I would then expect a sharp rally back towards the early-February highs. Such a rally should set the stage for another pullback. Though I do not generally favor bottom fishing, the volatile nature of the copper stocks does favor buying at converging support levels.
For FCX, buy at $44.90-$45.58 with a stop at $42.92 (risk of approx. 5.8%). On a move back above $55.55, raise the stop to breakeven.
As for SCCO, buy at $35.17-$35.88 with a stop at $33.88 (risk of approx. 5.5%). On a move back above $45.40, raise the stop to breakeven.


