At the end of a tumultuous week for the markets, we update the technical picture for gold and popular precious metals ETFs.
The wild trading this week in most of the world’s financial markets will likely go down in the record books. Those who have been around a while will likely compare it to the 1987 crash, while others will look back to the 1998 crisis for the Russian ruble and Long-Term Capital Management debacle.
Despite the high degree of uncertainty early in the week, I found it surprising that gold was not stronger. Part of this could be the result of the need to raise cash to support assets that were falling even faster, but the deterioration in the volume analysis since early in the year continues to indicate that fewer buyers are keeping prices higher. This continues to make gold vulnerable to a further decline and makes the risk high for new purchases at current levels despite the positive major trend.
Since early this year, I have become cautious about gold’s ability to push substantially higher over the near term and have expected instead to see a sharper decline that would stop out some of the weak long positions. This is what occurred in 2009 and 2010 when gold futures peaked around $1227 on December 2009 and eventually dropped as low as $1044 before the technical studies indicated that the correction was over. So did gold’s new high last week change the outlook?
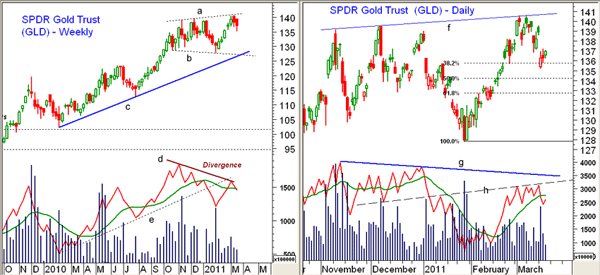
Chart Analysis: April Comex gold futures made a new high of $1447.50 on March 7 and the Spyder Gold Trust (GLD) also made a marginal new high at $140.61, line a. The weekly chart appears to be forming a broadening trading range (lines a and b).
- Despite the new price highs, the weekly on-balance volume (OBV) has continued to form lower highs (line d), indicating that fewer buyers are pushing prices higher. The OBV has just now rallied back to its former uptrend, line 3. It has again turned lower and looks ready to close the week below its weighted moving average (WMA)
- On the right side, you will note that the daily OBV has also formed lower highs (line g) and failed to move through even the shorter-term resistance, line h, on the recent rally
- The daily OBV is now below its weighted moving average and a drop below this week’s lows would be a sign of weakness
- The daily chart has initial support at $135.23, 50% support at $134.26, and 61.8% support at $132.68, which, if broken, should be followed by a drop to the weekly support (lines b and c) in the $127-$127.40 area
- Initial resistance is now at this week’s gap between $136.94 and $138.61
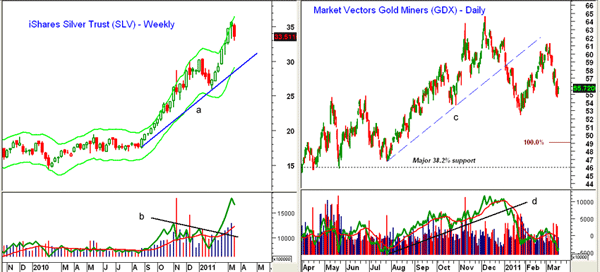
The weekly chart of the iShares Silver Trust (SLV) is much more positive, but the March 11 close above the upper weekly starc band suggested it might be ready for a rest. When any market closes above the weekly starc+ band, the odds are high that prices will move sideways, if not lower, over the next few weeks. The down gap opening on Tuesday sets the stage for a lower weekly close. Even if SLV were to correct further, the intermediate-term outlook is quite positive and shows no signs of a top.
- Short-term support is now at $32.49, and if violated, I would expect a decline to the January 2011 highs at $30.44. There is stronger support at $29-$29.40, which corresponds to the weekly uptrend (line a) and the starc- band
- As is the case with GLD, the monthly OBV (not shown) continues to confirm the price highs, which is positive for the major trend
- The weekly OBV broke through resistance (line b) in early February, and unlike GLD, it has made significant new highs with prices. This is very positive action. A pullback in the weekly OBV to its weighted moving average should set up a good buying opportunity
A few weeks ago, I noted here that the Market Vectors Gold Miners ETF (GDX) looked the most vulnerable technically. The rebound in GDX failed below the resistance at $62.20 (it peaked at $61.30) and it is now 9% lower.
- The daily chart looks negative with the next band of support between $52.46 and $53.67, which corresponds to the October 2010 and January 2011 lows
- If the January lows are broken, a decline equal to that from the December 2010 highs has an equality target (100%) now at $49. The major 38.2% support level stands at $46
- The daily OBV plunged through support in early January (line d) and was very weak on the rebound. The OBV has already dropped below the January lows, suggesting prices will follow
What It Means: The failure of volume in the gold futures and GLD to confirm the new price highs increases the probabilities of further weakness over the next several weeks. The fact that GLD has been in a trading range since last November makes it possible that it will just test the lower boundaries of the range and not see a drop down to stronger support at $125.
SLV also looks ready for at least some sideways to lower trading before it is ready to move above the recent highs. The gold miners continue to act the weakest and GDX is likely to drop below the January lows.
How to Profit: Since January 4, I have been advocating hedging long positions in GLD by selling calls. So far, the net result has been a loss of $215, but this has been made up by the gain in the price of GLD. In light of my long-term bullishness, I still feel this was the right strategy.
Those who are concerned about their positions in GLD or those who bought in the past six months could hedge their long position in GLD by selling the May 138 calls against their longs at $3.80 or better. They closed at $3.30. If GLD drops below $134 first, cancel the order. We will be watching SLV closely for a good risk/reward entry, and I have no recommendation for GDX.


