Banks have consistently underperformed, which means they could lead the charge downward during a longer-term correction. As you'll see from the analysis of these 4 blue chips, the fundamentals in the financial sector are extremely weak.
Since the stock market bottomed last summer, I have been concerned about the lack of participation of the financial sector in the ensuing rally.
The numbers don’t lie—the Financial Select Spyder (XLF) closed 2010 at $15.95, and settled Thursday at $16.00. In comparison, the S&P 500 is up 7.2% over the same period.
In February, I took a technical look at both Bank of America (BAC) and Citigroup (C), which were both reaching critical junctures. At the time, I advised having your stops in place to avoid big losers in your portfolio. Since then, they are down 14.6% and 9.3%, respectively.
Besides keeping these stocks out of your portfolio, the other major concern is what will happen once the stock market begins a meaningful correction. If the financial stocks, like the banks, are still weak when the market tops out, they are likely to lead the market on the downside.
These four financial bellwethers all look weak, and are likely to decline further. (Though I left out Bank of America this time, it still looks weak technically.) The relative performance analysis gave the investor advance warning of the declines in these stocks.
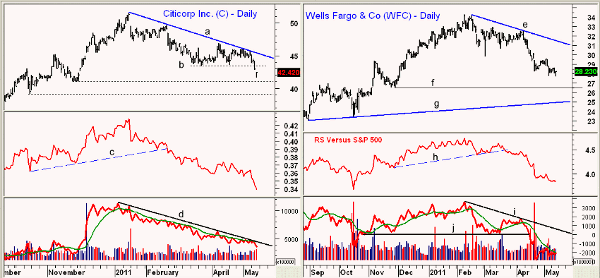
Chart Analysis: Citigroup (C) has been on the avoid list for sometime, and this week’s reverse stock split was a further negative, in my view. On Wednesday, it closed below key support (line a) and then gapped lower on Thursday.
- The daily chart has next support at $41, and then in the $39 area. A drop below last summer’s lows at $36.10 would be very negative
- The relative performance analysis (RS) turned negative in early February, when the uptrend (line c) was broken. It is still in a well established downtrend
- The daily OBV dropped below its WMA in January and is still declining (line d). The weekly OBV (not shown) also looks very negative
- Initial resistance now stands at $42.50, with major levels above $45
Wells Fargo (WFC) peaked at $34.25 on February 8, and so far has declined 18% from the highs, with the next chart support found in the $26.50 area.
- The longer-term uptrend (line g) is in the $25 area. The drop below the March 16 lows on April 15 was very negative
- The support in the RS (line h) was broken in March, and afterwards WFC bounced briefly to the $32.50 area before the sellers again took over
- The daily OBV peaked in February, and broke through strong support (line j) in April, confirming the price action. The OBV has plunged over the past month, and is well below its downtrend (line i)
- WFC is trying to stabilize on a short-term basis, with first resistance at $29.55. A daily close above this level would be encouraging
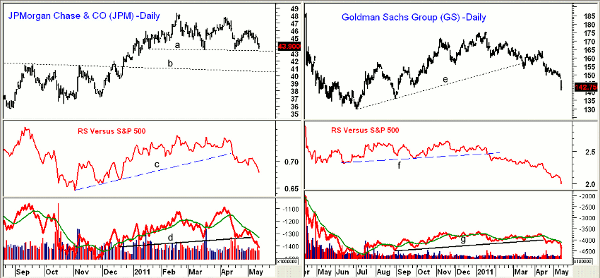
JPMorgan Chase (JPM) is trying to hold above the key support in the $43.60 to $43.40 area (line a). The technical studies suggest it will eventually be broken.
- The next good support is in the $40.50 area (line b), and then at $39
- The uptrend in the RS was broken on April 14, and has dropped further this week. This favors further weakness
- The daily OBV broke through support (line d) last week, which was negative. The weekly OBV (not shown) is below its WMA, but has not yet broken its uptrend
- There is initial resistance now at $46.07, and a daily close above this level is needed to stabilize the daily chart
Goldman Sachs (GS) is not technically a bank, but is clearly a leader in the financial sector—and it has been in the news this week for all the wrong reasons. Several analysts have also downgraded their outlook for the stock, which increased selling.
- GS broke its uptrend (line e) on the mid-March sell-off, then formed a continuation pattern by rebounding to $164.40. This pattern was completed with the April 13 down gap opening
- GS dropped sharply Thursday, with the next support at $136.65 and then $129.50. If this level is broken, the major 50% support stands at $123.50
- Once again, the RS analysis warned early of the stock’s future weakness, as it dropped below support (line f) on January 24, when GS closed at $166. It is in a solid downtrend, and shows no signs yet of a turnaround
- The daily OBV violated its support (line g) in April, and is well below its declining WMA. The weekly OBV dropped below its WMA in March, and is also in a solid downtrend
- With Thursday’s drop, there is first resistance now at $150, and further levels in the $155 area
What it Means: The stock market’s very negative action Wednesday suggested that we would see another wave of selling Thursday that could violate the prior week’s lows. This would have increased the odds of a drop to the 1,320 area in the S&P 500.
Instead, Thursday’s early selling was well absorbed, and the higher close has improved the short-term outlook. The A/D lines have turned up once more, and a positive close Friday should set the stage for further gains. The McClellan oscillator dropped to the zero line Wednesday, but has also turned up.
If the bank stocks and the overall financial sector fail to rally with the market, then these four stocks are likely to be more vulnerable as we head into the summer.
How to Profit: The analysis of these banks’ stocks reinforces the importance of using relative performance to analyze your stocks, and also to use stops to help you avoid disasters in your portfolio. One must remember that just one 20% or 30% loser often will erase gains from other stocks in your portfolio.
Only JPM has not yet violated support, and it could bounce once more from the support at $43.60 to $40. But if you are still long JPM, watch the rally closely and use it to close out long positions.
Of the other three stocks, C and GS look the most vulnerable, while WFC is closer now to strong support.


