Heading into the summer months, the charts of three sector ETFs in particular look the strongest, and bullish signs from another potential standout sector are emerging.
The second quarter has been a tough one for the major averages, and the first day of trading in June has many concerned about how the quarter will end. There have been only a few bright spots among the major market sectors, as four of the nine are currently underperforming the S&P 500.
On April 15, I analyzed the major sectors and used relative performance, or RS analysis, to identify “Two New Market-Leading Sectors.” Those were health care, as represented by the Select Sector SPDR - Health Care (XLV), and consumer staples, as tracked by the Select Sector SPDR - Consumer Staples (XLP).
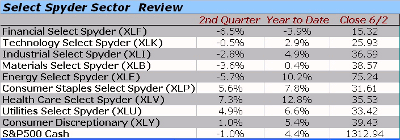
The performance results for the Select Sector SPDR ETFs shows that health care and consumer staples have been the star performers so far, up 7.3% and 5.6%, respectively. The Select Sector SPDR - Utilities (XLU) was the only other sector ETF to significantly outperform the S&P 500, as it was up 4.9% versus a 1% decline in the S&P 500.
The weakest sector ETFs were the Select Sector SPDR - Financial (XLF), down 6.5%; the Select Sector SPDR - Energy (XLE), down 5.7%; and the Select Sector SPDR - Materials (XLB), down 3.6%.
Each of those ETFs, along with the Select Sector SPDR - Industrial (XLI), which is down 2.8%, has been discussed in the past month. (See “2 Key Sectors Top Out” and "Big Oil’s Big Top.")
As we head into the summer months, there are three sectors in particular that look the best, and one sector that may be starting to outperform the S&P 500.
NEXT: Latest Charts for Health Care and Consumer Staples
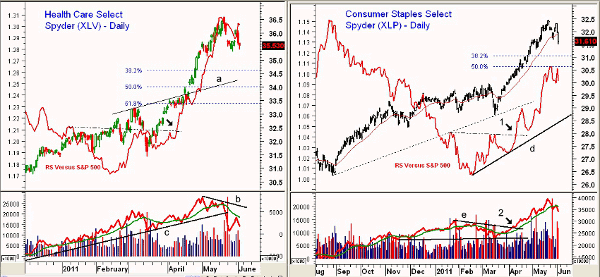
|pagebreak|Chart Analysis: The Select Sector SPDR - Health Care (XLV) peaked in mid-May at $36.44 and has corrected slightly from the recent highs. There is next support in the $35-$35.14 area.
- If XLV breaks this support, the 38.2% retracement level is at $34.60 with the 50% support at $34. This also corresponds to trend line support at line a
- There is more important support in the $33-$33.50 area
- The daily on-balance volume (OBV) formed a negative divergence at the recent highs (line b) that was confirmed by the break of the uptrend, line c
- The weekly OBV is positive and shows no divergences, so the daily readings suggest a pullback within the overall uptrend
- The relative performance, or RS analysis, completed its bottom formation in April (see arrow) and still looks positive
- There is short-term resistance now at $36
The Select Sector SPDR - Consumer Staples (XLP) has also corrected from the highs at $32.46 with the 38.2% retracement support now at $31.05.
- The 50% support level is at $30.60 with more important support in the $30 area
- The RS analysis still looks strong, having completed a bottom formation by overcoming resistance in April (point 1)
- The RS analysis was confirmed by the on-balance volume, as it overcame the key resistance, line e, in early April. The OBV has dropped below its weighted moving average (WMA) but did confirm the new highs
- The weekly OBV continues to look strong
- Initial resistance for XLP now stands in the $32-$32.30 area
NEXT: Utilities and Tech Sectors in Focus
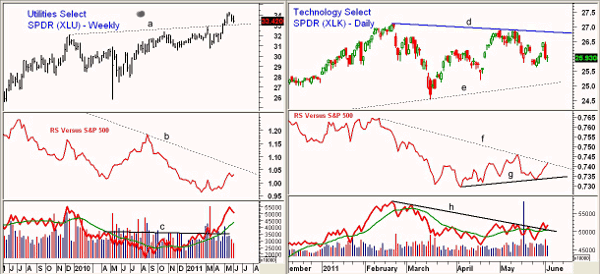
|pagebreak|The weekly chart of the Select Sector SPDR - Utilities (XLU) shows that it overcame major resistance, line a, in late April. It has pulled back from the highs at $34.44 and is close to testing the breakout level at $33.10.
- XLU has much stronger support in the $32-32.50 area
- The daily RS analysis (not shown) has broken its downtrend, and the weekly analysis also appears to show a completed bottom formation. A move in the RS through the long-term downtrend (line b) would be very positive
- The weekly OBV did complete its bottom formation in April when it moved through major resistance at line c. The daily OBV (not shown) is negative, allowing for a further pullback
- XLU has long-term resistance from 2008 in the $36-$38 area
I have been looking for the technology sector to lead the market higher for the past month or so, but that has not happened. The Select Sector SPDR - Technology (XLK) has just barely outperformed the S&P 500 this quarter, though it has improved technically over the past few weeks.
- Unlike the S&P 500, XLK is still holding above the May lows at $25.64 with further support at $25.20. The daily uptrend is now at $25.08
- The daily RS is in a gradual uptrend (line g), reflecting slightly better performance than the S&P 500. A move through its downtrend, line f, would be even more positive
- The daily OBV has broken through the downtrend dating back to February, line h, which is a positive sign. The weekly OBV is still below its weighted moving average
NEXT: How to Profit from Summer’s Hottest Sectors
|pagebreak|What It Means: Wednesday’s drop in the stock market and the heavy selling early Friday in reaction to the weaker-than-expected monthly jobs report both indicate the stock market can still decline further.
The intermediate-term outlook remains positive for the market, however, and a further correction should be a good opportunity to buy my three favorite sector ETFs. More speculative traders may already be long the tech sector, and it could still bottom out ahead of the S&P 500.
How to Profit: My more recent recommendations for both XLP and XLV were not filled, and these levels have been adjusted as follows:
Select Sector SPDR - Health Care (XLV): Go 50% long at $34.40 and 50% long at $33.74 with a stop at $31.68 (risk of approx. 7.4%).
Select Sector SPDR - Consumer Staples (XLP): I first recommended going 50% long at $31.12 and 50% long at $30.74 with a stop at $29.44 (risk of approx. 4.8%).
Select Sector SPDR - Utilities (XLU): Go 50% long at $33.16 and 50% long at $32.86 with a stop at $31.48 (risk of approx. 4.6%).
I will continue to watch the Select Sector SPDR - Technology (XLK) while looking for confirmation of a low.
Portfolio Update
For more aggressive traders, last week I recommended buying Direxion Daily Technology Bull 3x Shares (TYH) at $45.62 with a stop at $43.91 (risk of approx. 3.7%). This order was filled on Thursday when the fund closed at $45.66. Sell half that position at $47.94 (for a 5% gain) and raise the stop to $44.90.


