
The ongoing downside move in physical gold and the SPDR Gold Trust (GLD) may still have more room to travel, but these three chart and volume signals will confirm when the correction is over.
As global stock markets have continued to drop sharply, investors have rushed to buy bonds and gold, which are perceived as safe havens by those who think the economic recovery has stalled.
The June Comex gold futures contract is up almost $45 from its lows, but is still $270, or 14% below the September 9 high of $1928.30. Though bottom fishers may be attracted by the fact that gold is so far below its recent highs, historically, this has not been a very severe correction.
As discussed here on March 21, my technical and sentiment analysis suggested that a further decline was needed before a bottom could be completed.
The SPDR Gold Trust (GLD) did make slightly lower lows last week, and the sentiment picture has clearly become more negative. Mark Hulbert has written that his own sentiment indicator, which tracks the views of short-term gold-market timers, is at the most negative level since March 2009.
Technically, I am looking for three specific developments to indicate that GLD has bottomed and that we will not see another 5%-8% decline before a low is in place. Here are the signals to watch for.

Click to Enlarge
Chart Analysis: The above weekly chart (left panel) of the SPDR Gold Trust (GLD), updated through Friday, April 5, shows that last week’s close was below the weekly uptrend, line a.
- This uptrend goes back to the 2008 lows and was also violated in late-December 2011, but GLD did not close below this uptrend
- The weekly Starc- band is now at $149.90 and was last tested in November 2011
- Weekly on-balance volume (OBV) has turned down and closed just above its flat weighted moving average (WMA)
- To signal a bottom for GLD, the weekly OBV needs to start a new uptrend by closing above resistance at line b. This would likely mean a strong weekly close with volume above 60 million shares
- OBV has long-term support at the uptrend, line c, which goes back to the early-2010 lows
- Short-term support now stands at $157.50-$158.50, which, if broken, would signal a further decline
The daily chart for the SPDR Gold Trust (GLD) (right panel) shows that there is near-term resistance between $164.89 and $165.55.
- More important resistance is at $170 with major resistance, line d, in the $174 area
- OBV is still in a shallow downtrend, line f, but has just moved back above its weighted moving average
- Daily volume has been declining, and the 30-day average is now 13 million shares
- A daily close above the OBV resistance at line f would be another sign that GLD has bottomed
- Daily support for GLD is now at $156.50 and then at the gap in the $151.70-$152.70 area
- Additional support is at $150.60, line e, with much more important support at $148.27 (Dec. 29 low)
NEXT: Clever Close-Only Chart Shows Key Patterns
|pagebreak|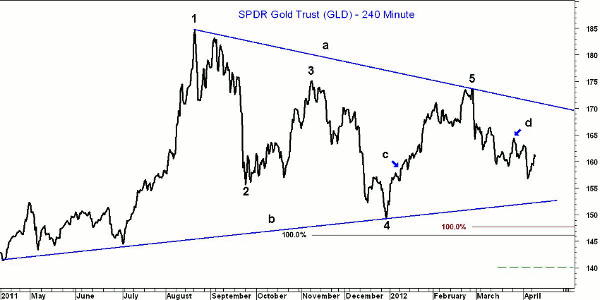
Click to Enlarge
This 240-minute close-only chart of the Spyder Gold Trust (GLD) can be helpful not only in determining Fibonacci price targets, but also in determining when a market starts a new uptrend or downtrend.
- The chart shows a major flag formation, lines a and b, which is likely a continuation pattern, or pause in the major uptrend
- Completion of this formation would give upside targets in the $194-$195 area
- On January 10, GLD closed above the January 5 high of $157.78 (point c), signaling that a new uptrend had begun
- In early March, GLD confirmed a downtrend. To signal that a new uptrend has begun, GLD needs a 240-minute close above $164.60 (point d)
- On the downside, a 240-minute close below $156.65 will reassert the downtrend
- There is trend line support in the $152.50 area, line b
- Using the decline from point 1 to point 2, the 100% Fibonacci price projection target from the high at point 3 is at $146.10 (in black)
- An additional price projection target can be determined using the decline from point 3 to point 4, and then measuring down from the high at point 5. This gives a target at $147.70 (in red)
- Both of these targets are below the December low, and if this low were to be violated, it would be likely to turn the remaining bulls negative on gold
What It Means: In the last four weeks, gold futures and the SPDR Gold Trust (GLD) have both continued to decline. My best-case scenario at this time is still for a further decline before a bottom can be completed.
Because it has been 30 weeks since GLD peaked on September 6, and the bearish sentiment has since increased, one must consider that gold could bottom at any time. Therefore, the three signs I am looking for to confirm that GLD has bottomed would be: 1) an upside breakout in the weekly OBV; 2) a move through daily OBV resistance; and 3) a 240-minute close in GLD above $164.60.
How to Profit: Until these signals are evident, I am sticking with my previous recommendation to go 50% long the SPDR Gold Trust (GLD) at $148.55 and 50% long at $146.80 with a stop at $139.20 (risk of approx. 5.7%).


