The completion of double-bottom formations in these leveraged stock index ETFs could foretell a deeper and longer-lasting market correction than many currently anticipate.
The stock market’s weak close on Thursday ahead of Friday’s monthly jobs report has encouraged those who are negative on the stock market. The Advance/Decline (A/D) lines, which turned slightly positive early in the week, are now back to neutral after the A/D numbers were quite negative on Thursday. The jobs report missed estimates, but early on, the reaction of the stock index futures was muted, which does not change my analysis.
Generally, one day of market action is not so important in the big scheme of things, and that may be the case on Friday, but occasionally, it can tip the balance one way or the other. Those who are using inverse ETFs to trade or hedge their equity exposure are watching closely to see if the potential double-bottom formations are completed.
Last fall, I discussed double-bottom formations in detail as crude oil had completed a double bottom in October. That formation projected at least a $12 rally in crude oil, which was met just a month later.
Now, many of the popular inverse ETFs, and even some of the inverse sector ETFs, show price and volume patterns consistent with double-bottom formations. One of these ETFs is one I have previously recommended, and by identifying the key levels to watch, we should be well prepared for the market’s next major move.
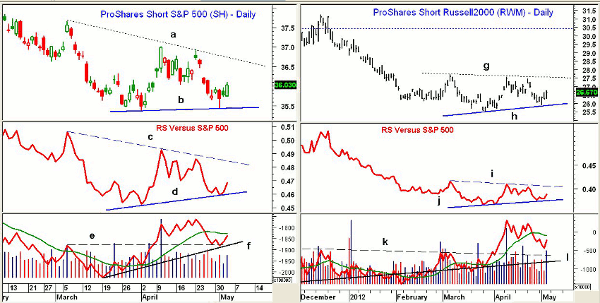
Chart Analysis: The ProShares Short S&P 500 ETF (SH) dropped to a low of $35.42 on Tuesday and held above the April 2 low of $35.37 as well as the recommended stop of $35.18.
- There is first resistance now at the gap in the $36.23-$36.47 area with the downtrend (line a) now at $36.76
- To complete the double-bottom formation (line b), SH needs to close above the April 10 high at $37.02
- The initial upside target is at $38.65. SH traded as high as $42.37 last December
- Relative performance, or RS analysis, has formed higher lows, line d, which is positive. A move above the resistance at line c would be more positive
- The on-balance volume (OBV) does show a potential bottoming formation, as it has been acting much stronger than prices, line f. The OBV retested the breakout level (line e) this week
As I have noted previously, it was negative that the Russell 2000 A/D line formed a negative divergence at the March highs (see chart). The ProShares Short Russell 2000 ETF (RWM) is a quite liquid inverse ETF trading well over two million shares daily.
- RWM formed higher lows this week, line h, as the low at $25.88 was well above the March 27 low of $25.50
- There is key resistance at $27.57-$27.70. If overcome, the upside targets are at $29.90
- The 38.2% Fibonacci retracement resistance calculated from the October 2011 highs is at $30.40
- RS analysis is trying to complete its bottom formation, line j, but needs a strong close above the resistance at line i to confirm
- Daily OBV completed its bottom formation in early April when it surged through resistance at line k
- Volume picked up on Thursday and the OBV has held well above long-term support at line l
NEXT: Highly Liquid ETF to Short the Nasdaq 100
|pagebreak|Apple Inc. (AAPL) is down around 3.5% so far this week, and those who think that it and the Nasdaq 100 index can fall further may be buying the ProShares UltraPro Short QQQ (SQQQ). It is a liquid 3x inverse ETF tracking the PowerShares QQQ (QQQ), which carries a weighting of more than 18% in AAPL.
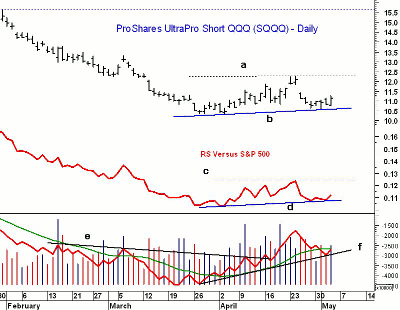
- The daily chart of SQQQ shows a potential double-bottom formation even though it has formed slightly higher lows, line b
- This week’s low of $10.56 was above the April 3 low of $10.31
- A close above $12.26 would complete the double bottom with upside targets at $14.21
- Conversely, a close below $10.31 would indicate that the recent trading range (lines a and b) was a continuation pattern, not a double bottom
- The RS line is also locked in a trading range, lines c and d, so the April highs need to be overcome to complete the bottom
- Daily OBV broke out in April when it moved well above the resistance at line e
- The breakout level has been retested and the OBV is barely back above its weighted moving average (WMA) and has short-term support now at line f
What It Means: The action in the inverse ETFs suggests that the stock market may be vulnerable to a deeper correction in the coming weeks. If these ETFs just test the key resistance from the double-bottom formations and then turn lower, it will confirm that the stock market is locked in a trading range.
If, on the other hand, the double-bottom formations are completed, then it would increase the chances that we are going to see a deeper and longer correction that could last several months.
How to Profit: For the ProShares Short Russell 2000 ETF (RWM), go 50% long at $26.44 and 50% long at $26.14 with a stop at $25.38 (risk of approx. 3.5%).
There is no recommendation at this time for the ProShares UltraPro Short QQQ (SQQQ).
Portfolio Update: Buyers should be 50% long the ProShares Short S&P 500 ETF (SH) at $36.26 and 50% long at $36.06 with a stop at $35.18. On a move above $36.74, raise the stop to $35.92.


