A closer look at technology, which has sold off strongly of late, pulls up a few stocks and a key ETF that could lead the seasonal rebound in the sector, writes MoneyShow's Tom Aspray.
Last week was a rough one for the tech sector, and the pessimistic comments from Advanced Micro Devices (AMD) likely accelerated the selling, as its shares were down over 14%. The hard-disk makers were also sold after two key players were downgraded by a Citigroup analyst.
Given the decline over the past three weeks, it should not be surprising that many stocks are much closer to the lower weekly Starc- bands. Typically, when a stock or ETF closes at or below its lower weekly Starc- band, the probabilities are high that it will either move sideways or rebound for a few weeks.
When the weekly Starc- bands coincide with other important support levels, and the longer-term technical readings are positive, then a test of the weekly Starc- band can also be a good buying opportunity.
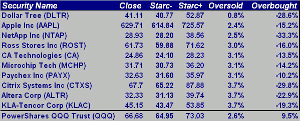
The table reveals that ten of the Nasdaq-100 stocks are with 4% of their weekly Starc- bands, including the Nasdaq-100-tracking PowerShares QQQ Trust (QQQ), which closed at $66.68, just 2.5% above its weekly Starc-band at $64.95. Apple (AAPL) is the second oversold stock on the list, and its weekly Starc- band is very close to my initial buy level.
For those who are not invested in the tech sector, here are one tech-heavy ETF and three technology stocks that you should take a look at during the current market weakness.
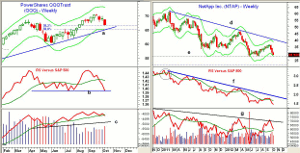
Chart Analysis: The Powershares QQQ Trust (QQQ) tested the 38.2% support at $66.54 last week and closed near the lows. Since QQQ peaked on September 19 at $70.58, it has lost 5.5%.
- The daily uptrend is at $65.60, with the 50% retracement support and the weekly uptrend (line a) in the $65.30 to $65.10 area.
- The weekly relative performance reached the March highs last month before turning lower.
- The RS line dropped below its WMA at the end of September, and is now testing stronger support.
- The weekly OBV did confirm the highs, and is now testing its WMA.
- The OBV is well above stronger support (line c), while the daily OBV (not shown) is below its WMA.
- There is initial resistance at $67.50 to $68.
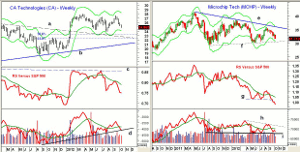
NetApp (NTAP) is a $10.5 billion designer and manufacturer of network storage devices that has been declining since February 2011, when it peaked at $61.02. It has dropped over 50% from this high.
- The major 61.8% support from the 2008 lows at $10.39 has been broken, as NTAP is just above longer-term support at $27.55.
- The relative performance formed a very slight divergence at the 2011 highs (see circle), and shows a long-term downtrend (line f).
- The RS line has just made marginal new lows.
- The weekly on-balance volume (OBV) rose strongly from the May lows, and marginally broke through its long-term downtrend.
- The OBV is still holding above its WMA, but is currently declining.
- The daily OBV (not shown) is below its WMA, but is well above the May lows.
- NTAP reports earnings on November 14.
NEXT: Which of These 4 Plays Are Buys Now?
|pagebreak|CA Technologies (CA) is an $11.6 billion application software company that yields 4%. The weekly chart shows a broad trading range for most of 2012.
- The weekly Starc- band is at $24.10, with the 50% support at $23.36.
- The former downtrend (line a) is now support in the $22.70 area, with 61.8% support at $22.27.
- The relative performance dropped sharply in July and shows a series of lower highs.
- The OBV shows a long-term uptrend from the 2011 lows (line d) that is now being tested..
- A higher close this week would be the first sign that a low may be in place.
- There is first resistance in the $25.60 to $26 area.
- CA reports earnings on October 25.
MicroChip Tech (MCHP) is a $6.14 billion specialized semiconductor company that currently yields 4.4%. The weekly chart shows what may be a long-term continuation pattern (lines e and f).
- The weekly Starc- band is at $30.73, with chart support (line f) just slightly lower at $30.65.
- The early 2012 low was $30.23, with the 2011 low at $29.30.
- The relative performance has dropped below its recent lows (line g), and is still in a solid downtrend.
- The weekly OBV is below its WMA, but is still holding above long-term support (line i).
- The OBV needs to move back above its WMA and resistance (line h) to confirm that the correction is over.
- There is resistance now at $33.70 to $34.40.
- MCHP reports earnings on November 8.
What it Means: The technology sector, and specifically the semiconductor subsector, both typically bottom in October.
The charts of these three technology stocks need a couple positive weekly closes to indicate that their corrections are over. Of the three, NetApp (NTAP) and CA Technologies (CA) look the closest to bottoming.
For those not already invested in Select Sector SPDR Technology (XLK), I would recommend the PowerShares QQQ Trust (QQQ) at slightly lower levels.
How to Profit: For PowerShares QQQ Trust (QQQ), go 50% long at $66.34 and 50% long at $65.74, with a stop at $63.77 (risk of approx. 3.4%).
For NetApp (NTAP), go 50% long at $28.34 and 50% long at $27.56, with a stop at $26.74 (risk of approx. 4.3%).
For CA Technologies (CA), go 50% long at $24.24 and 50% long at $23.86, with a stop at $22.94 (risk of approx. 4.6%).


