
As the housing market appears to have finally hit bottom, real estate in general, and REITs in particular, are once again attracting attention, and MoneyShow's Tom Aspray takes a technical look at this sector to see if now is a good time to jump back in.
The stock market's early gains Monday were quickly lost as fresh concerns grew over the latest Cyprus plan. The early rally took the futures above their latest peak and likely stopped out some on the short side. However the Spyder Trust (SPY) still needs a close above Monday's high at $156.27 to signal a new push to the upside.
The futures are a bit higher early Tuesday and this has been the type of vegematic market I was discussing a few weeks ago. The daily technical studies have still not given any sell signals, though this does not rule out a deeper correction before the overall uptrend resumes.
The yield on the 10-year T-note declined a bit Monday and is down from earlier in the month when it was above 2%. Still that meager yield does not compete with the yields on many large-cap stocks or the high-yielding REITs.
The majority of REITs have a pretty clear seasonal tendency, and there is one office REIT that looks attractive for new purchase at slightly lower levels.

Click
to Enlarge
Chart Analysis: The weekly chart of Diversified REITs broke through weekly resistance, line a, in early 2013 and looks strong.
- Typically this index of Diversified REITs forms a
major low on November 23 and rallies into early February.
- It forms a secondary low on March 9 and then rallies
into late April before it undergoes a couple of months of weakness.
- The index forms a final high on September 21 and then
is typically vulnerable until November 23.
Of course, you can also do seasonal analysis on individual stocks. Mack Cali Realty Corp. (CLI) is a $2.51 billion office REIT that operates mainly in the northeastern, US as well as Washington DC. It has a current yield of 6.30%.
- CLI typically bottoms on November 25 and then rallies
until the end of January.
- The stock then forms a secondary low on March 9.
- From then until September 21, CLI typically moves higher.
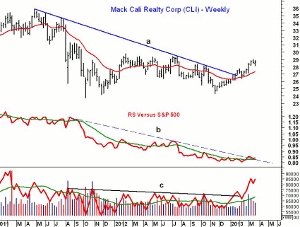
Click
to Enlarge
The long-term weekly chart of Mack Cali Realty Corp. (CLI) shows that it broke its long-term downtrend from early 2011, line a, in January.
- The recent high at $29.02 was just below the July
2012 high of $29.44.
- This also corresponds to the 50% Fibonacci retracement resistance with the 61.8% level
at $30.60.
- The relative performance broke its long-term downtrend,
line b, in early March.
- The RS line appears to be completing a bottom and a
move above its recent highs will confirm it.
- The on-balance volume (OBV) has been very strong in 2013
as it moved through eighteen month resistance, line c.
- The OBV shows a bullish zig-zag formation and the
daily OBV (not shown) confirmed the recent highs.
- There is initial support now at $27.70-$28.20 with
the 20-week EMA at $27.22.
What it Means: All of the REITs show a fairly similar typical seasonal pattern. One of the oldest healthcare REITs, Health Care REIT, Inc. (HCN), using data that goes back to the early 1980s, has a typical low in late November and a high in July.
Some of the other REITs and leading REIT ETFs now look as strong currently as CLI.
How to Profit: For Mack Cali Realty Corp. (CLI), go 50% long at $28.04 and 50% long at 27.44, with a stop at $26.29 (risk of approx. 5.2%).


