Overnight, the emerging markets sell-off intensified into a rout, and MoneyShow’s Tom Aspray looks to the charts for clues on what the next move ought to be for global investors.
As the month draws to a close, the so called “TIP countries,” Thailand, Indonesia, and the Philippines are suffering some of the worst monthly losses as they are down 9.6%, 11.4%, and 10.5% respectively. This has caused many to question their investments in the Asian markets.
The sentiment towards the Japanese market has remained positive overall as the NK225 is down just 2.4%, so far, in August. The index peaked in May at 15,942 and is still down over 16% from the highs. The Japanese yen is flat for the month after its sharp drop versus the dollar since the early 2012 high.
The initial sharp drop from the May highs took prices to important support, which set up a good buying opportunity in the Japan-focused ETFs. Japanese equities are holding well above the June lows and the yen is now in a holding pattern. But what should investors do now? Buy, sell, or stand pat?
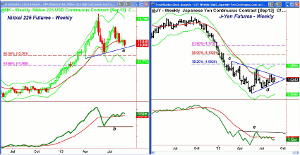
Chart Analysis: The weekly chart of the Nikkei 225 futures shows that prices have pulled back to support that connects the April-June lows, line a.
- This support is now in the 13,000 area with the June low at 12,490.
- The major 50% Fibonacci retracement support is at 12,291 with weekly starc- band at 11,798.
- The key 61.8% retracement support stands at 11,369.
- The OBV rebounded sharply from the June lows (line b) and moved back above its WMA.
- The OBV has stayed in a narrow range for the past six weeks but is holding above its WMA.
- The daily chart (not shown) reveals a tight trading range with the 20-day EMA at 13,667.
- A close back above the 14,100 level would be a positive sign.
The weekly chart of the Japanese yen futures shows the low at 0.9652 in late May after it peaked in September at 1.3012.
- This was a decline of 25.8% and the weekly chart shows that prices are near the apex of its triangle formation, lines c and d.
- A move back above 1.0440 would indicate a further strengthening in the yen.
- The weekly starc+ band is at 1.0855 with the 38.2% retracement resistance at 1.0926.
- The OBV confirmed the June lows in the yen and it has dropped back below its WMA in the past few weeks.
- There is key resistance for the OBV now at line e.
- A weekly close below 0.9850 will confirm a further decline in the yen.
- There is long-term support for the yen from 2008 now at .9328.
NEXT PAGE: What It Means
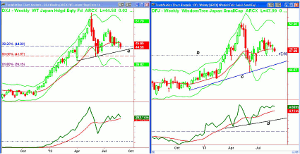
|pagebreak|The WisdomTree Japan Total Dividend Index (DXJ) hit a high of $49.54 in mid-July as the weekly chart shows that a doji was formed (see circle).
- An LCD sell signal was triggered the following week.
- The uptrend on the daily chart (not shown) was broken as DXJ hit a low of $44.31 and then made new correction lows on Tuesday at $44.06.
- The weekly uptrend, line a, is now at $43.42 with the 50% retracement support at $41.91.
- The weekly starc- band is at $39.82 with the 61.8% support at $39.15.
- The weekly OBV has turned lower but is still well above its rising WMA.
- The daily OBV (not shown) is negative as it dropped below its WMA on July 24.
- The first key resistance is the quarterly pivot at $47.01.
The WisdomTree Japan SmallCap Dividend (DFJ) hit a low in early June at $44.07 and then made a series of higher lows and highs, peaking at $50.34 in mid-July.
- The weekly chart shows first support now at $47.08, line b, which was the late July low.
- A decisive break of this level will suggest a drop back to the weekly uptrend, line c, at $45.42.
- The weekly starc- band is at $44.57, which also corresponds to more important chart support.
- The weekly analysis is still positive as the OBV moved back above its WMA at the June lows.
- It is still holding above its rising WMA and more important support at line d.
- A daily close back above the $50 level would be a positive sign.
What It Means: The weekly analysis on the Nikkei 225, as well as DXJ and DFJ, is still positive but the daily analysis is negative. Therefore, a further pullback is still possible over the near term while the longer-term outlook still favors a stronger yen and a higher Nikkei 225.
The negative action in the US markets will require a much stronger rally to reverse. If remaining longs in the WisdomTree Japan SmallCap Dividend (DFJ) are stopped out, I will look for a new entry level once the daily studies turn back to positive.
How to Profit: I am now looking for new daily buy signals on the WisdomTree Japan Total Dividend Index (DXJ) as our long positions were stopped out.
Portfolio Update: For the WisdomTree Japan Total Dividend Index (DXJ), a 50% long position was established at $44.54 and 50% long at $43.26. We sold ½ at $45.10 and got stopped out of the other half at $44.38 for a small profit of 1.9%.
For WisdomTree Japan SmallCap Dividend (DFJ), should still be 50% long at $45.66 and 50% long at $44.76, with a stop now at $46.36.


