
Despite the market’s overall strength, this has not been a good year for homebuilders, and MoneyShow’s Tom Aspray investigates whether or not it’s time to buy some beaten-down stocks in this sector now.
Monday’s record close was followed by a lower opening Tuesday, and for a change, the rally attempts failed as stocks closed lower. Small caps were hit the hardest as the Russell 2000 closed down 0.90% versus a 0.32% loss for the S&P 500. The A/D ratios were negative all day and were almost 2-1 negative on the Nasdaq Composite.
The decline was consistent with the weak technical readings that accompanied Monday’s new highs and another down day is likely to cause even more technical damage. The Hang Seng and Shanghai Composite took a big hit overnight while the Euro markets are slightly higher in early trading.
With just over two weeks left in 2013, money managers are trying to decide what sectors or groups they should be invested in as they head into the New Year. The housing market has been a growth engine for the economy since the fall of 2011 but the homebuilding stocks have been lagging the overall market in 2013.
Is now the time to move into this battered group of stocks or is it still too early?
Click to Enlarge
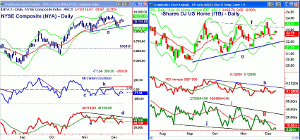
Chart Analysis: The NYSE Composite (NYA) triggered a LCD sell signal with Tuesday’s close below Monday’s doji low. It would take a move back above 10,159 to reverse this short-term sell signal.
- The close was just above the 20-day EMA with next support at 10,000 (line a).
- More important support at 9900 and the early November lows.
- There is additional support at 9700 with the quarterly pivot at 9558.
- The McClellan oscillator continues to look weak after the rally failures in November, line b.
- The break of support at line c created a new downtrend, and at -71, it is well above oversold levels.
- The NYSE Advance/Decline line continues to diverge from prices after failing to make a new highs with prices at the end of November, line d.
- The divergence was confirmed by the break below support at line e.
- A drop below last week’s lows would be consistent with heavier selling.
The iShares DJ US Home Construction (ITB) surged above resistance, line f, at the end of November but then reversed to close the day near the lows.
- ITB is still down 13% from the May high at $26.21 and is up just 7.8% YTD.
- The resistance at line f was tested Tuesday but ITB again closed on the lows.
- There is next support at $21.90 and the uptrend, line b, with the starc- band at $21.68.
- Additional support is in the $30.37 to $20.81 area with the major 38.2% Fibonacci support at $19.36.
- The relative performance is still in a downtrend and did not breakout with prices in November.
- The RS line is just barely above its WMA.
- The OBV was much weaker than prices in November (see arrow) and is well below the resistance, line i.
- The OBV shows a pattern of lower lows but the weekly (not shown) is still above its WMA.
NEXT PAGE: 2 Homebuilders to Watch
|pagebreak|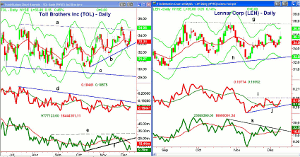
Click to Enlarge
Toll Brothers Inc. (TOL) reported a 65% in earnings on Tuesday but this was offset later in the day by the recent drop in new sales contracts. The stock was up over 3% in early trading but closed the day with a slight loss.
- The next support is in the $21.87-$22.13, which corresponds to the monthly projected support and the quarterly pivot.
- The daily uptrend (line h) is in the same area with the weekly starc- band at $20.14.
- The relative performance has just rallied back to its declining WMA and is well below the longer term downtrend.
- The daily OBV dropped below support, line f, at the end of November and is now very close to the October lows.
- TOL also had a fake breakout in November as the OBV failed to move through resistance at line e.
- The weekly OBV (not shown) is still holding above its WMA and does look much more positive.
- A strong close back above $23.70 is needed to turn TOL around.
Lennar Corp. (LEN) is still locked in its broad trading range, lines g and h, as it is still 19% below the May high of $44.29.
- There is resistance now at $35.90 (starc+) and the trend line at $37.57.
- A strong close above $37.80 would be bullish.
- The relative performance has formed higher lows, line j, and a move above resistance at line i, would complete a bottom formation.
- The daily OBV has broken through its downtrend, line k, and is looking more positive.
- The weekly OBV (not shown) has been much stronger than prices since October when it broke through major resistance.
- There is first support now at $33.82 to $34.09 with the monthly projected support at $33.07.
- The support at $32.15, from the November lows, is more important.
What It Means: The deterioration in the technical studies still favors a further decline in the overall stock market. One sharp down day and a lower weekly close would confirm a more serious market decline. This would be in line with my year-end target for the stock market.
Last August, I had expected the homebuilding stocks to bottom out by the fall but they have not. Clearly, some of these stocks, like Lennar Corp. (LEN) are acting much better than others. Two others I am watching are PulteGroup Inc. (PHM) and D.R. Horton, Inc. (DHI) as they have been acting a bit better.
The fake upside breakouts for some of the stocks and ITB in November still suggest it is too early to buy the group or some of the homebuilding stocks. Some like Lennar Corp. (LEN) are trying to bottom out ahead of the others.
The positive longer-term outlook for many of the stocks does suggest that they will offer some good opportunities down the road. Over the short term, increased taper fears and higher yields are likely to limit their upside.
How to Profit: No new recommendation
Portfolio Update: For Lennar Corp. (LEN), should be 50% long at $33.14 and 50% long at $32.44, with a stop now at $32.87. On a move above $36.70, raise the stop to $33.77.


