
As earnings season begins in earnest this week, MoneyShow's Tom Aspray takes a technical look at this market-leading sector for new buy candidates.
Not even the much-weaker-than-expected monthly jobs report could derail the majority of stocks last week as the advancing stocks led the decliners for the week by almost a 2 to 1 margin. The Dow Industrials and NYSE Composite were a bit lower for the week while the still booming healthcare sector was up 2.8% for the week.
There were also sharp gains in the Dow Utilities, up 2.6%, and the Dow Transportations surged late last week to close up 1.9%. The strength of the Transports is consistent with an economy that is going to get even stronger. The stock index futures are lower in early trading while the Euro markets are mixed.
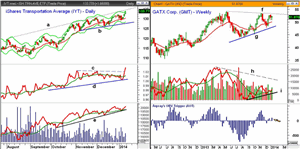
As noted in the Week Ahead column, the weekly relative performance analysis of the iShares Transportation Average (IYT) broke out to the upside last week indicating that this group can continue to lead the market higher. There are many stocks in the group that have already broken out to new highs but these three stocks now look ready to join the party.
Click to Enlarge
Chart Analysis: The iShares Transportation Average (IYT) tested its 20-day EMA early last week and then rallied to close above its daily starc+ band. This allows for a pullback or some sideways action over the near term.
- The monthly projected pivot resistance is at $136.15 with the weekly starc+ band at $137.46.
- The relative performance surged to the upside last
week as resistance at line c was overcome.
- Volume increased on Friday and the daily OBV is now
testing the late December highs.
- The OBV dropped back to trend line support (line e)
and its rising WMA last week.
- The close Monday was above the monthly pivot at $130.04 as the low was $129.11.
- The uptrend is now at $127.32 with the recent
correction lows at $126.
The GATX Corp. (GMT) is a $6.40 billion company that rents and leases transportation equipment. This includes both railroad, as well as shipping of dry bulk commodities. It currently yields 2.39%.
- The weekly chart shows that it has been forming a
flag (lines f and g) since the May 2013 high at $54.19.
- There is resistance now at $53.44 with monthly
projected pivot resistance at $56.10.
- The completion of the flag formation would project a
move to the $65-$67 area.
- The weekly on-balance volume (OBV) has formed a short-term
uptrend (line i) and turned up from its WMA.
- The Aspray's OBV Trigger (AOT) reflects the bounce from
the WMA as it has moved above the late December highs.
- On a break below $50.50, the monthly projected pivot
support is at $49.02.
NEXT PAGE: 2 More Transport Picks
|pagebreak|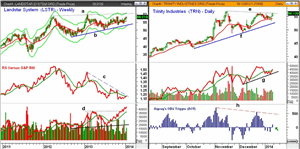
Click to Enlarge
Landstar System (LSTR) is a transportation and logistics services company with a market cap of $2.7 billion. The weekly chart shows a broad trading range since late 2011, lines a and b.
- There is key resistance now in the $60.50 area, which
also corresponds to the weekly starc+ band and the monthly projected pivot
resistance.
- The trading range is $12 to $14 wide so an upside
breakout has targets in the $72.50-$74.50 area.
- The weekly relative performance closed above its WMA last week
and is testing its downtrend, line c.
- The daily RS analysis (not shown) is above its WMA
and does appear to have bottomed.
- The weekly OBV has been acting much stronger than
prices as it has moved well above the early 2013 highs (line d).
- There is minor support now at $57-$57.50 with the quarterly pivot at $56.62.
Trinity Industries (TRN) is a $4.4 billion manufacturer of railroad, as well as marine and other structural products.
- The daily chart shows last Friday's close just below
the upper boundary of its flag formation at line e.
- The November high was $56.92 with the monthly
projected high at $60.79.
- The formation has upside targets in the $65 area with
the quarterly pivot resistance at $65.50.
- The daily OBV moved above its WMA last Friday and the weekly
(not shown) made new highs last week.
- The AOT had been below the zero line in January but
turned positive last Friday.
- There is first support now at $53.80-$54.80 with the
quarterly pivot at $51.48.
- The daily and weekly relative performance (not shown)
are both positive.
What It Means: The early December analysis of the Transports and its industries suggested a pullback would be a buying opportunity. The turnaround was even faster than expected as last week's breakout was confirmed by the technical studies.
These three stocks also show positive signals from Aspray's OBV Trigger (AOT) buy signals and GATX Corp. (GMT) along with Landstar System (LSTR) look the best for new positions.
It will take a deeper correction in order to hit the buy levels in the iShares Transportation Average (IYT) and in Trinity Industries (TRN).
How to Profit: For iShares Transportation Average (IYT), go 50% long at $131.22 and 50% long at $129.72, with a stop at $125.43 (risk of approx. 3.9%).
For GATX Corp. (GMT), go 50% long at $51.58 and 50% long at $50.66, with a stop at $48.47 (risk of approx. 5.2%).
For Landstar System (LSTR), go 50% long at $57.72 and 50% long at $56.84, with a stop at $54.57 (risk of approx. 4.7%).
For Trinity Industries (TRN), go 50% long at $53.46 and 50% long at $51.84, with a stop at $49.73 (risk of approx. 5.5%).


