Recent market divergence is consistent with a pullback, so MoneyShow’s Tom Aspray takes a technical look at three sector ETFs that have not yet surpassed their summer highs to determine if any should be bought on a correction.
For the second day in a row, most of the major averages and the A/D ratios were slightly negative. Tuesday’s leaders, the Dow Transports and small-cap S&P 600 were both lower on the day with the Dow Utilities gaining 0.49%.
The McClellan oscillator has deteriorated further as it is now down to +58 after peaking at +181 on August 19. This divergence is consistent with a pullback but the bullish A/D line analysis indicates that a correction will be a buying opportunity.
The recent sharp increase in the bullish sentiment of individual investors was also consistent with a pullback. This week, the bulls became more cautious as the bullish % dropped to 44.67% as of September 4, down from 51.82% a week ago.
The monthly OBV analysis of the market leading PowerShares QQQ Trust (QQQ) and the Spyder Trust (SPY) has confirmed the new price highs. There are three sector ETFs that have not yet surpassed their summer highs, but should they be bought on a market correction?
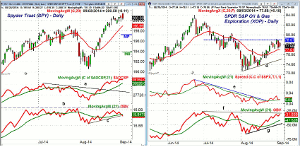
Chart Analysis: The Spyder Trust (SPY) made a new high Wednesday at $201.41 but closed a bit lower on the day.
- There is very short-term support at last Friday’s low of $199.39 with the rising 20-day EMA at $198.96.
- The monthly pivot and further support is at $197.36, which would be a 38.2% Fibonacci pullback from the highs.
- The monthly projected pivot support is considerably lower at $193.90.
- The daily S&P 500 A/D line did make another new high this week and is well above its rising WMA.
- The move in the A/D line above its downtrend, line a, on August 18, was a positive sign.
- The daily OBV has failed to confirm the new highs while the OBV on the S&P 500 has made a new high.
- The OBV has now closed below its WMA and the short-term support, line c.
The SPDR S&P Oil & Gas Exploration (XOP) is up 13.56% YTD, which is much better than the 9.56% gain in the SPY.
- XOP has rebounded back to the quarterly pivot at $78.97.
- There is further resistance in the $80-$80.50 area.
- XOP is still 8.1% below the June high at $82.40.
- The 20-day EMA is rising slightly and is now at $77.01.
- There is additional support in the $76 area with the uptrend (line c) now at $75.
- The daily relative performance broke its downtrend, line d, in August.
- The RS line is now testing its rising WMA but the weekly RS line is still below its WMA.
- The daily OBV is acting stronger as it is already close to the June highs, line e.
- The OBV is well above both its rising WMA and support at line f.
- The weekly OBV (not shown) did make a new high last week.
NEXT PAGE: Two More ETFs to Watch
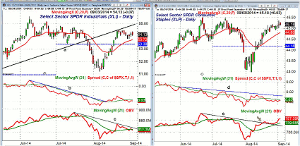
|pagebreak|The Select Sector SPDR Industrials (XLI) has underperformed all year as it has just gained 4.5% YTD. It has a yield of 1.76%.
- The largest holding is General Electric Co. (GE) which makes up just over 10% followed by a 5.5% holding in Union Pacific Corp. (UNP). XLI has 45.7% in its top ten holdings.
- XLI broke the major uptrend, line a, that goes back to the April 2013 lows.
- So far, the rally from the August lows has been unable to move above this resistance.
- There is additional resistance at $54.82 with the monthly projected pivot resistance at $55.28.
- There is near term support at $53.72 and the rising 20-day EMA.
- The quarterly pivot is at $53.38 with more important support in the $52.40-$52.60 area.
- The relative performance has dropped back below its WMA after breaking its downtrend, line b, in early August.
- The weekly RS line is still well below its WMA.
- The daily OBV is now slightly below its flat WMA.
- The OBV has short-term resistance at line c, but needs to move above the late August highs to turn positive.
The Select Sector SPDR Consumer Staples (XLP) is up 6.38% YTD and is not far below the 52-week high at $45.51. XLP has been boosted by its 2.46% yield.
- Procter & Gamble (PG) is the largest holding as it makes up 13.3% of the portfolio followed by 9.3% in Coca-Cola, Inc. (KO). Though there are a total of 40 holdings with just over 63% in the top ten holdings.
- The rising 20-day EMA is now at $44.80 with the quarterly pivot at $44.18.
- The daily chart has more important support in the $43.50 area.
- The low in August and the important weekly support is at $42.97.
- Despite the rally from the August lows, the relative performance is below its WMA.
- A move in the daily RS line above the resistance at the downtrend, line d, will signal it is a market leader.
- The weekly relative performance has been below its WMA since June.
- The daily on-balance volume (OBV) moved through its downtrend, line c, in the middle of August but is still below the June highs.
- The weekly OBV (not shown) is very close to making new highs.
What it Means: The Powershares QQQ Trust (QQQ) did form a daily LCD on Wednesday consistent with a short-term top. A pullback to the $96.50-$97.50 area is possible while the Spyder Trust (SPY) could test the $196-$197 area.
Even though crude oil prices are down over $3 per barrel so far in 2014, the energy stocks have held up quite well. Some of the individual oil stocks look stronger than XOP, which was recommended in early August’s Digging for Bargains.
Given the strong manufacturing data recently, the industrial stocks should start to catch up with the S&P 500 before the year’s end. I would look to buy Select Sector SPDR Industrials (XLI) on a pullback. Several of the oversold S&P 100 stocks are part of the industrial sector and they will be watched for new buy signals.
The Select Sector SPDR Consumer Staples (XLP) is a more defensive sector and I have no new recommendation for now.
How to Profit: For the Select Sector SPDR Industrials (XLI) go 50% long at $53.36 and 50% long at $52.54 with a stop at $50.46 (approx. risk of 4.7%).
Portfolio Update: For SPDR S&P Oil & Gas Exploration & Production (XOP) should be 50% long at $75.12 and 50% at $73.88 with a stop now at $72.88.


