
Though many stocks have been hit hard, some market leading industry groups have been bucking the trend, so MoneyShow’s Tom Aspray looks to see if the technical outlook suggests they can continue to lead for the rest of the year.
The market did a good job of absorbing Monday’s selling pressure with the Dow Industrials and Nasdaq 100 closing a bit higher with the S&P 500 showing a small loss. The market internals were slightly lower on the day and the McClellan oscillator declining to -172.
There is a full slate of economic data today and the FOMC meeting starts, so many are waiting for their announcement on Wednesday afternoon. As I noted yesterday, there are also 150 S&P 500 stocks that will report earnings. After the close Monday, Twitter, Inc. (TWTR) was hit hard losing over 10% as its 4th quarter guidance disappointed investors.
Since the end of August, the Spyder Trust (SPY) is down 2.1%, the SPDR Dow Industrials has lost 1.5% while the PowerShares QQQ Trust (QQQ) is down just 0.85%. There have been some industry groups that have been bucking the trend as the DJ US Footwear Index (DJUSFT) has led the way up 10.8%, beating the SPY by almost 13%.
The technical outlook for three other market leading industry groups suggests that they can continue to lead for the rest of the year.
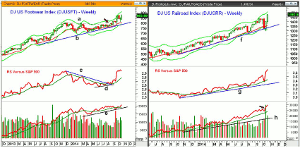
Click to Enlarge
Chart Analysis: The Dow Jones US Footwear Index (DJUSFT) is led by Nike, Inc. (NKE), which is up over 17% and Wolverine World Wide, Inc. (WWW) gaining 8.5%.
- The industry group completed its weekly flag formation on August 22 as it had a weekly close above the resistance at line a.
- The weekly starc+ band is at 910 with the upside targets from the flag formation in the 720-730 area.
- The index came close to its rising 20-week EMA twice in the past month and it is now at 802.50.
- The relative performance led prices higher as it overcame the resistance, line c, at the start of August.
- This completed the bottom formation (line d) and the RS line has confirmed the new highs with the WMA rising strongly.
- The weekly OBV has also made a new high with good support at line e.
The DJ US Railroad Index (DJUSRR) is up 7.8% since the end of August, led by double digit gains in Union Pacific (UNP) and CSX Corp. (CSX).
- Two weeks ago, the DJUSRR dropped briefly below its weekly starc- band before reversing to close back above its 20-day EMA.
- The weekly starc+ band is now at 1512.
- The weekly uptrend, line f, was also broken on this decline.
- The relative performance reversed to the upside after testing its rising WMA.
- The RS line shows a long-term uptrend, line g.
- The weekly on-balance volume (OBV) made another new high two weeks ago as the volume was strong.
- The daily OBV (not shown) is also positive.
- There is initial support at 1420-1430 with the rising 20-day EMA at 1402.
NEXT PAGE: Two More Industry Groups to Watch
|pagebreak|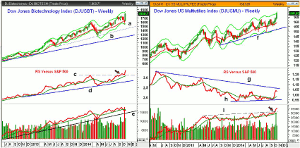
Click to Enlarge
It should not be a surprise that the DJ US Biotechnology Index (DJUSBT) is one of the top performer industry groups over the same time period as it is up 5.2%,considerably better than the SPY. Its top performer IBio, Inc. (IBIO) is a $1.44 stock that is up 268%.
- DJUSBT also briefly tested its weekly starc- band on the recent market decline.
- The starc+ band is now at 1857 with chart targets in the 1900-1920 area.
- Once below the recent low at 1539, the intermediate trend support is at 1426, line a.
- The relative performance broke out in September (see arrow).
- After a brief pullback, it has now surged to the upside.
- The weekly OBV is below its WMA but did turn up last week.
- The daily OBV (not shown) is very strong and has already made new highs.
- There is initial support at 1725 with the rising 20-day EMA at 1688 or 6.2% below current levels.
The DJ US Multiutilities (DJUSMU) is up 5% and is just slightly trailing the biotechnology index. It is lead by Vectren Corp. (VVC) up 11.3% and Duke Energy (DUK) up 9%.
- The close last week was just below the weekly starc+ band at 170.38.
- The breakout of the weekly trading range has upside targets in the 172-175 area.
- The relative performance shows a potential bottom formation, line h.
- The recent rally appears to have completed this formation with key resistance at line g.
- The weekly OBV has broken above the upper trend line resistance, line i.
- The volume has been strong over the past two weeks.
- There is initial support in the 165-166 area with the 20-day EMA at 162.35.
What it Means: These four industry groups clearly are acting like market leaders, so stocks within these groups should be examined for new buy candidates but remember to keep the focus on the risk and look for pullbacks to buy.
How to Profit: Now new recommendation.


