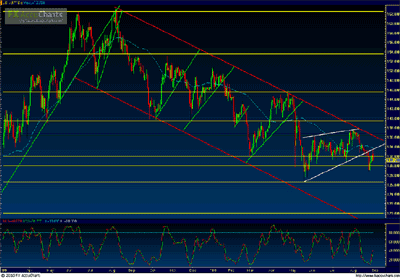
Price action on GBP/JPY (a daily chart of which is shown) as of Monday (8/30/2010) has pulled back up to the lower border of the large rising wedge formation that it broke down last week before reasserting its bearish stance.
(Price on first pane, Slow Stochastics on second pane; horizontal support/resistance levels in yellow; uptrend lines in green; downtrend lines in red; chart patterns in white; 50-period simple moving average in light blue.)
The low that was reached on the wedge breakdown before pullback was in the 128.75 price region, around a three-month low for the pair.
This occurs within the context of a long-term parallel downtrend channel extending back to the August 2009 high. In the event that price furthers its bearish trend momentum to break below the 128.75 low, a key downside support target resides around the long-term 126.70 low just hit in May.
Any strong breakdown below that level would confirm a downtrend continuation. In terms of key long-term technical support in the event of a breakdown below that level, price would not be too far off from the all-time low at 118.80, hit in January 2009.
By James Chen, chief technical strategist, FXSolutions.com


