Discover a fast and easy way to create a pivot point moving average using the popular Metatrader forex trading platform.
First off, what is a pivot point? A simple definition from Wikipedia:
“A pivot point is a price level of significance in technical analysis of a financial market that is used by traders as a predictive indicator of market movement”
Related Reading: Using Pivot Points to Predict Future Prices
Many traders use pivot points as special support and resistance areas in their trading and find it is worthwhile to pay attention to these levels. Some traders even use the pivot point as the day’s up or down point; any price above the daily pivot suggests looking for long positions, while below the daily pivot suggests looking for short positions. Daily, weekly, and monthly pivot points are very commonly used, but pivots can also be used on any other time frame.
Some reasons that a pivot point moving average may be of significance are for spotting trend changes, reversals, and trend strength. When prices continually close above or below the daily pivots, this would indicate a strong trend is happening, while changes in this trend could indicate a reversal may be in order. Of course, it is always best to use this information in combination with other trading methods or indicators.
Pivot Point Calculation
The standard calculation of a pivot point uses the one period’s price information to “predict” a significant price point for the next period.
Pivot Point = (High + Low + Close) / 3In addition to the pivot point, traders usually watch three support (S1, S2, S3) and three resistance (R1, R2, R3) levels that are based off the calculations of the pivot point. However, this moving average article will not deal with those levels.
Plotting on Metatrader
To plot a pivot point moving average, you will not need any special indicators or downloads. You can use the standard moving average indicator that comes in Metatrader.
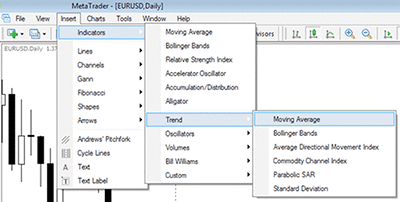
Open up your Metatrader platform1. From the Insert tab on the top menu, select Indicators > Trend > Moving Average
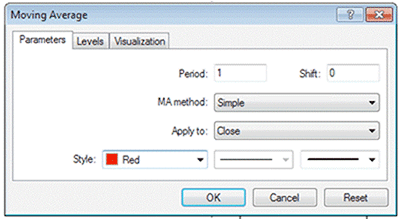
2. The moving average box should pop up on the front of your screen:
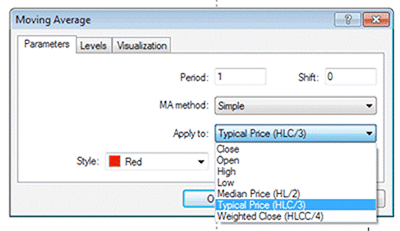
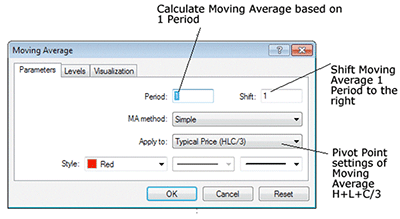
3. You want to set the period option to 1 to get the pivot level off just one candle. Next, scroll down to the Apply to: option and select the pivot point calculation named Typical Price (HLC/3).
4. Finally, since pivot points are calculated from the candle close of one period to be useful or “predictive” for the next period, you want to shift the moving average to the right. Go to the Shift option or window and put in 1.
The moving average window should look like this:
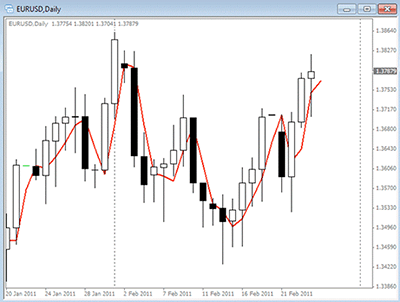
Click OK and you should see something like this:
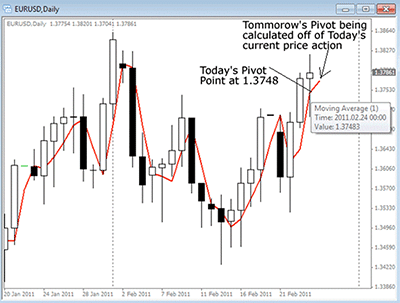
Remember that the current candle has the current pivot point plotted right on it (using the previous candle’s price information). In this case below, the daily doji-type candle all the way to the right is currently above the day’s pivot point of 1.3748.
The moving average is also in the process of calculating tomorrow’s pivot based on today’s price action, and that is seen by the moving average extending to the far-right side. This pivot will not be fully relevant until the current day’s close.
A quick calculation to confirm the accuracy of today’s moving average pivot level from the HLC prices from yesterday’s fuller candle (on the left of today’s doji-like current candle) shows:
1.3786 (high) + 1.3683 (low) + 1.3775 (close) / 3 = 1.3748, or today’s pivot point
Finally, to see the pivot price, put your cursor over the moving average on your Metatrader chart and a price window should show up just like in the above image.
By the Staff at CountingPips.com
Find more forex trading ideas and strategies at CountingPips.com

