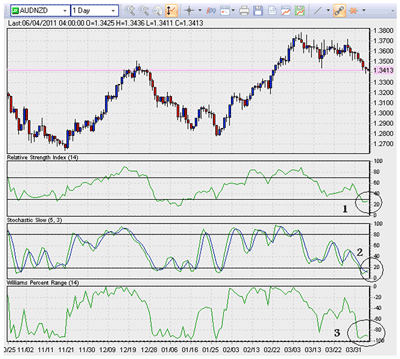
Three proven technical indicators are giving bullish signals on the AUD/NZD currency pair, and traders should be prepared to go long in search of potentially significant profits.
Over the last week and a half, the AUD/NZD has experienced a bearish trend that has brought the pair down over 300 pips. Technical indicators are now showing that the pair may be in store for a bullish correction in the near future, providing forex traders with an excellent opportunity to open up long positions for some potentially significant profits.
We will be looking at the daily chart for AUD/NZD, provided by Forexyard. The technical indicators being examined are the relative strength index (RSI), slow stochastic, and Williams percent range (%R).
- The RSI has recently crossed into the oversold zone in what is typically a sign that a reversal is likely to take place. Furthermore, it appears that the indicator is beginning to angle upwards in a clear indication that the pair may turn bullish in the near future.
- The slow stochastic has recently formed a bullish cross. Traders can take this as a clear sign that a trend reversal may be imminent.
- Finally, the Williams %R has crossed well below the -80 level in what is the clearest sign yet that the pair is in oversold territory. Traders will want to pay attention to this indicator. When it begins to turn upward, it will be a likely sign of impending bullish behavior.


