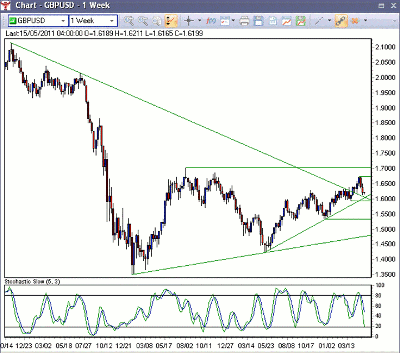
The GBP/USD pair has fallen to a level where strong support may help bring about a renewed push higher. Downside risk is present, however. Here are the key levels for traders to watch.
On a weekly chart, the British pound has seen a steady rise since its most recent swing low in May 2010. However, in the past few weeks, we’ve seen it decline a bit after bouncing off resistance in the area of previous highs made in November 2009.
The decline in the GBP/USD is approaching a level where two trend lines merge and could provide a technical level for a bounce higher. Currently, cable trades at 1.6200, but following the decline over the past two weeks, momentum has shifted to the downside, as shown by the falling weekly Stochastics.
One area on the chart stands out, as the GBP/USD has two merging trend lines near the 1.6050 level. The first trend line rises off of the May 2010 and December 2008 lows, while the second trend line falls off of the November 2007 and July 2008 highs.
Cable bounced higher from the later trend line, which turned into a support level, as previous trend lines often do. Below this apex, further support rests at the March low at 1.5935, followed by the late-December low at 1.5340.
To the upside, should the bullish trend continue, GBP/USD would look to rise to this year’s high at 1.6750. A breach here and traders could expect the pair to rise to the August 2009 high at 1.7040.
By the Staff at ForexYard.com


