It’s not the newest, “cant-miss” indicator; it’s actually a mythical one created only to emphasize the importance of sticking with basics like supply and demand and not searching for the “Holy Grail” of trading.
I’m sure many of you have seen, heard, or even traded some of the popular currency pair patterns or set-ups out there. I’m referring to things like head-and-shoulders patterns, double tops, double bottoms, triangles, etc.
What about the latest moving average crossover? How about the three-period exponential moving average (EMA) crossing the eight-period EMA when the 34-period EMA is trending in the same direction?
Many of these different entry/exit techniques have been around for a long time, but just get regurgitated by some new guru promising fantastic riches if you follow this “new” scheme.
The bottom line, which we teach at Online Trading Academy, is that supply/demand imbalances give you the highest-probability, lowest-risk, and highest-reward trades out there.
When considering a new strategy, does it take into account the supply and demand imbalances, or is it just another late-to-the-party trend-following technique? While the patterns that we all have read about in many trading articles, Web sites, and trading books can work, without the proper application of supply and demand, you are just guessing in the marketplace.
See related: Chart Patterns Every Trader Should Know
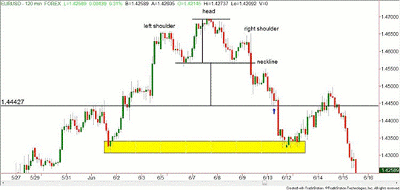
In the following chart, I’ve identified a simple head-and-shoulders pattern. Most trading "textbooks" will refer to the pattern itself, with its characteristic identifiers and the measured move. “Measured move” is also referred to as a measured objective, profit target, etc. Basically, it means "Where will this pattern take us so I can exit the trade where everybody else does?" But if you do what everybody else does, do you really have an edge? That would be a no.
NEXT: See Recent EUR/USD Trade Example
|pagebreak|Let’s take a look at a two-hour EUR/USD chart:
The textbook measured move on our bearish head-and-shoulders reversal pattern is as follows: The distance from the top of the head to the neckline is applied to the neckline for our exit target. In this chart, that measured move is at the blue arrow.
As you’ll see, this pattern worked perfectly. In fact, when the measured move lines up with a previous supply or demand level, the probability of at least a pause at this level increases dramatically.
Now, look a bit lower on the chart. Notice the obvious demand zone in yellow that has been identified. There are a couple of decent demand zones near the measured move, but the yellow highlighted area would be a more distinct target for the Online Trading Academy student. While the measured moves can be helpful in determining profit objectives, our supply and demand zones should be more effective.
How many different chart patterns are there? That would be dozens, if not hundreds of variations of some of the common patterns out there! At last count, I was aware of seven different types of double bottoms; seven! How many different ways do you need to measure a retest of a previous demand level? Do you need to know seven? I hope not!
So, the question becomes “Why is it that traders relentlessly search the Internet for the ‘Holy Grail’ of trading?”
Is the Holy Grail a newly discovered pattern or trading set-up combination? Perhaps it is the all-but-unheard-of “Papa’s Moustache,” the newest style of inverse head-and-shoulders patterns. (Yes, that pattern is fictional; thanks Matt G. for the hilarious name!)
I believe the reason people search tirelessly for this Holy Grail is because many people don’t want to take their small losses in trading. This is a fundamental truth in successful trading: You must take the small losses on your own or the market will eventually make you take large losses where you will have no choice in the matter!
See related: There’s No “Holy Grail” Indicator
A mantra that is repeated at Online Trading Academy is that small losses are a part of the business. If you can’t accept that fact, I wish you the best of luck in your next career, because trading will only be a hobby for you.
As I have stated in previous articles, the Holy Grail in trading is risk management. Take the small losses and let your winners run. Buy in demand zones and sell in supply zones, paying attention to the overall trend of the time frame you trade.
See video: Minimize Losses Every Time
Is that really so difficult? Stop wasting your time looking for the “Papa’s Moustache” and concentrate on your own trading discipline. This is what will really make you more successful.
By Rick Wright, instructor, Online Trading Academy


