
Using historical price action in the EUR/GBP currency pair, Richard Krivo of DailyFX.com explains how to identify and trade the popular bullish and bearish engulfing pattern set-ups.
What qualifies as an engulfing candle is fairly simple: as long as the body of a candle "engulfs" the previous candle in terms of the body (some will say wicks as well), it would be considered an engulfing candle. As such, it can indicate that a move in the opposite direction of the candle that was "engulfed" may take place.
In other words, if a bullish candle is engulfed by bearish candle, the higher-probability direction to trade the pair will be short. If a bearish candle is engulfed by a bullish candle, the higher-probability direction to trade would be long.
Remember, just because a trader sees an engulfing candle does not mean that a move in the opposite direction is assured. As far as being certain goes, a trader can be certain that a candle is an engulfing candle, but we can never be certain of what may transpire on the chart going forward.
Below you will find an historical four-hour chart of the EUR/GBP currency pair. Examples of engulfing candles are outlined with bullish engulfing in black and bearish engulfing in green.
No two candles will be exactly alike, although you will see that the criteria for an engulfing candle is met in each.
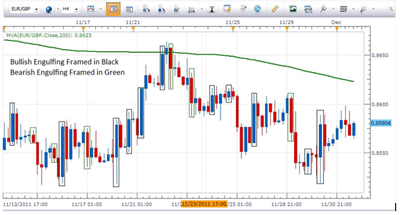
Click to Enlarge
Keep in mind, as is the case when interpreting candlesticks, a trader cannot make a decision regarding what a candle might turn out to be until that candle is closed.
For example, the last candle on the right of the chart at this point looks like a bullish engulfing. However, when the four-hour period closes and that candle closes along with it, based on price action between now and then, that candle may turn out not to engulf the previous candle at all.
Always wait for a candle to close before making a trading decision based on it.
One strategy that can be used when an engulfing candle is identified is to only take a trade when the candle signals a potential change of direction when that change is in the direction of the trend. In other words, in a downtrend, we would look for bearish engulfing candles, and in an uptrend, we would look for bullish engulfing candles.
Should the trade be taken, the stop would be placed below the bullish engulfing candle in an uptrend and above the bearish engulfing candle in a downtrend.
Lastly, be sure to note that there are several engulfing candles on the chart where a move in the opposite direction did not take place after the engulfing candle closed. As usual, nothing in trading is ever a certainty.
See also: How to Trade Engulfing Bar Patterns
By Richard Krivo, contributor, DailyFX.com


