
James B. Stanley, a trading instructor with DailyFX.com, explains how supply and demand forces influence the price of everything, including currency prices.
The primitive forces of capitalism rule markets like the laws of gravity. Buyers and sellers provoke a battle to find a happy medium agreement in every market on the face of the planet.
As prices dance around on charts, traders are often looking to a number of reasons to explain price movements. And oftentimes, a number of reasons can be associated with these types of changes.
But at its core—every single price movement is denominated by supply and demand. Positive news means increased demand and lessened demand—equating to higher prices. Negative news usually spells lower demand and increased supply.
Supply and Demand Spelled Out
Supply is simply the amount available, while demand is the amount that is wanted. Think of supply and demand in the most simple of terms, from the standpoint of any market where buyers and sellers exchange goods.
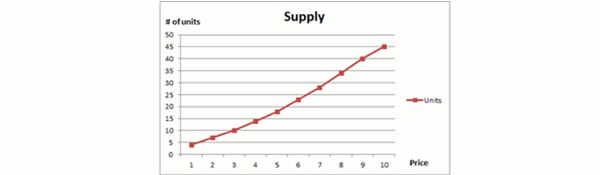
Let’s for a moment imagine that you are selling oranges from your own farm at a local market. And you don’t necessarily have to sell all of your oranges, because, after all, you can eat them just as easily as anyone that buys them from you.
But the higher price you can charge for your oranges, in general, the more willing you would be to part with them. If oranges are only fetching $1 per bag, you might be willing to sell four or five bags. But as price goes up, you decide to make more available. All the way up to $10 per bag, at which point you are more than willing to sell every last orange you have because you can easily take all the money you made and buy something else to eat.
The graph below is called a "supply curve," and it expresses this relationship. The red line indicates supply, which increases as prices move higher (located on the horizontal axis).
Click
to Enlarge
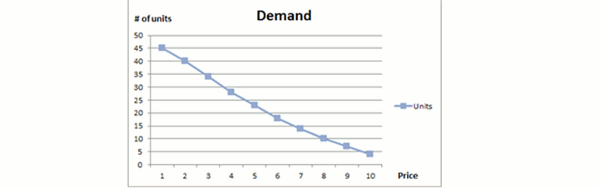
And on the opposite end of the spectrum, we have demand. Now think of the buyer-seller relationship from the vantage point of the consumer. The lower the price, the higher demand will be—the exact opposite of our supply curve.
If oranges were only $1 per bag, we’ll we’d want to buy as many as we could because it would be an extreme value. As price increases, so does our demand because, after all—if oranges are $10 per bag—we can easily find replacement products to use instead of oranges.
Click
to Enlarge
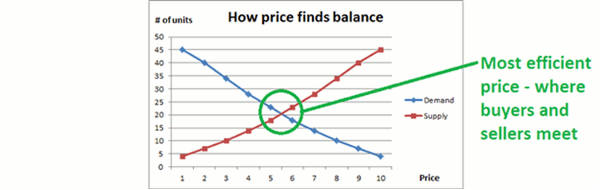
And these two competing forces meet in the marketplace to decide the prices that will be paid and the number of units that will change hands. This is how price is discovered in a free market environment, the same way that prices are set on trading platforms around the world, and it can be expressed in the chart below:
Click
to Enlarge
Next: Supply and Demand in the Forex Market
|pagebreak|Supply and Demand in the Forex Market
The analogy of oranges at a farmer’s market is not all too dissimilar from that which takes place every day in the currency market.
In some cases, these forces are moving at such high velocity that new traders can have difficulty understanding the granularity of the details; but rest assured—the forces of supply and demand run true to markets whether you’re looking at a tick chart or real estate prices.
The FX market is one of the most voluminous on Earth, and the reason for that is the heavy demand behind the traded assets. Currencies are the basis for the world’s economy. Whenever one economy wants to trade with another economy (provided different currencies are used), an exchange will be required.
Supply and Demand at Work
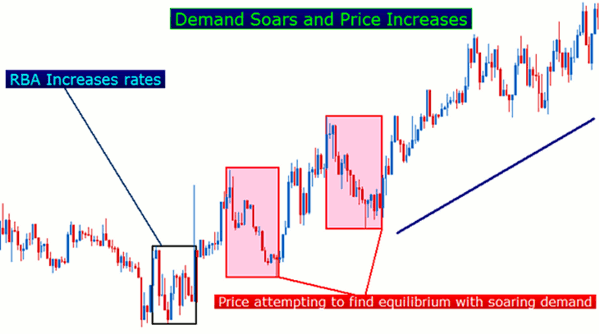
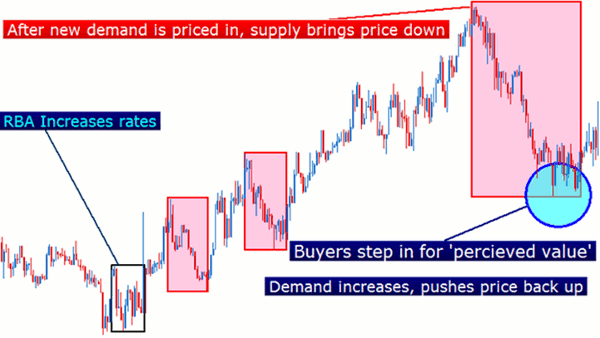
Imagine that the Reserve Bank of Australia enacts an interest-rate change. An entire chain reaction will be set in motion due to the forces of supply and demand.
When rates increase, rollover payments also increase. This means that investors that are holding the trade open at 5 p.m. Eastern Time will receive a higher rate of interest than they would have previously. Incentive has just increased.
So naturally, more traders will want to buy, and fewer traders will want to sell, as the opportunity cost of doing so (the rollover payment) has just gotten more expensive.
Click
to Enlarge
Price aims to find a comfortable point, and will increase until there are no more buyers willing to pay that price. At this point, sellers outnumber buyers, and price will respond by moving down.
Click
to Enlarge
After price has moved down far enough (circled in blue), traders will come back into the picture, remembering the increased interest rate and the additional rollover payment that can be had from holding a long AUD/USD position, and this lower price presents a "perceived value."
As additional buyers enter the picture, price will move up to reflect this increased demand. And then price will, once again, move so high that traders no longer want to enter the picture at that price level, and price will respond by moving down.
This is but one example of the Supply and Demand relationship, on one time frame...but we can even see this relationship playing out in the tick chart of any currency pair.
Watch the Advanced Dealing Rates Window of Trading Station II during a fast market, as microcosmic examples of this phenomenon are taking place throughout the trading day. This is the process of price attempting to find its fair value...it takes place on many different time frames in every market in the world.
James B. Stanley is a trading instructor with DailyFX.com.


