Forex trader, Nick Simpson of Forex-FX-4X.com gives examples of contrarian price action trading strategies, where a trader may look to fade the obvious moves.
Have you traded a breakout of support or resistance recently and had a stop loss hit soon after? Anyone trading blind breakouts is most likely used to the market reversing on them. There a many reasons why breakouts can fail as momentum wanes. One school of thought is that the market is constantly searching for liquidity and big traders will try to gain a fill in areas where the underlying price is less likely to move against them as they build significant positions. Traders who are building significant positions do not want to push price against them when they hit the market with “size.” Clusters of stop losses and similar orders are very useful for big traders in this regard and bull and bear traps are all too common.
Fading the Breakout of Range Resistance
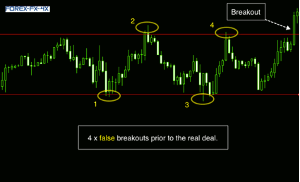
A look at the following figure 1 example shows a defined range, which actually extends further to the left than shown here. Many text books advocate trading a breakout of these patterns but the reality is not so clear cut…. In this example, there are around four false breakouts prior to the real deal breakout to the upside, which comes at the far right of the chart. Anyone with a keen eye will note that the reversals were often precipitated by a price action candle reversal including inside bars, pin bars, and doji candles.
Order flow often builds around the extremities of these ranges. Some market participants are looking for a range trading breakout to occur and are transacting with the aim of capturing a continuation move. Other traders are looking for a reversion to the range and have placed limit orders accordingly.
Here are some of the technical elements that may be worthy of consideration as price approaches these range support and resistance areas.
- Is the market taking a breather after a strong directional move or is the general theme one of a ranging consolidation phase?
- If the market is trending, then what direction is the predominant trend? Always be especially wary of fading the main trend unless you have a compelling reason to do so.
- Does the higher time frame chart give any directional bias?
- What time of day/year is the breakout occurring. Perhaps during the peak London open period, as many market participants are following the price action; or by way of contrast, is it a thin illiquid holiday market?
- What technical confluence levels are aligned with the range extremes, if any?
- Has the market in question covered the typical daily range already?
NEXT PAGE: Fading a New Low
|pagebreak|These are just a few areas of consideration and other factors, including upcoming event risk, should likewise be weighed up.
Figure 1
Fading a New Low
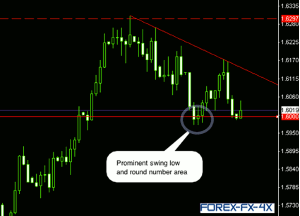
We will now look at another false breakout scenario. In this instance (see figure 2) the market is slowly but surely declining after hitting the 1.6300 area resistance (dotted red line). A series of lower highs has been made and the market has moved into a psychological round number and previous support area. The resulting bounce was around 170 pips and the price action then gives another move to prior support lows.
Figure 2
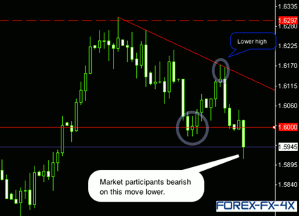
Price then breaks below the previous low in figure 3 and closes under the 1.6000 handle. So we have a close below a major psychological round number area, a lower high, and a breakout below support. This could potentially give many traders a bearish directional bias, which they may choose to act upon and short the market. After all, are we not supposed to trade with the trend according to the so called “gurus” and text book analysis methods?
Figure 3
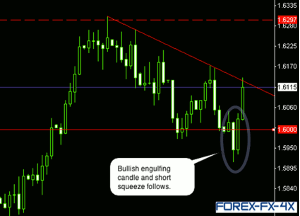
Things become interesting in figure 4 as the market pares back the previous day’s losses and closes above the 1.6000 handle. Our bearish traders are now experiencing a “short squeeze” as the market pushes higher. The price action candle reversal setup came as a bullish engulfing pattern formed. Essentially, the market made a key reversal and our fictional bearish traders are now feeling the pain.
We mentioned above how the market often reverses after we have entered a trade; it is also not unusual for the very same market to once again reverse after we decide that our losing position needs to be closed…wouldn’t you agree from personal experience?
Figure 4
Contrarian-minded traders will sometimes look to fade breakouts, like the example shown above. These kind of moves will often take the ”weaker hands” out of the market before a support or resistance level holds for a given period of time. Fading a strong trend is never a wise move but the market will often give false breakouts on moves counter to the prevailing sentiment.
I am of the opinion that the price action should be monitored around levels like the one shown above and any reversal can then be taken into account when conducting our analysis. The fact that the move above, in example two, was trading into a major round number adds weight to any subsequent bullish rejection, in my opinion. Other areas including major Fibonacci cluster levels, support and resistance, or moving averages also figure in my analysis in a similar way; the more confluence a level has the better.
By Nick Simpson of Forex-FX-4X.com


