Michael Michaud of Invest2Success Blog answers the question of whether it is possible to make money swing trading forex in this recent turbulent environment.
Some major currency pairs are offering excellent trading and investment opportunities in the weeks and months to come. This is according to Van Tharp International Institute of Trading Mastery. Why? As Van always points out in his monthly market updates:
“Crisis always implies opportunity. Those with good trading skills can make money in this market—a lot of money. There were lots of good opportunities in 2012, and many more to come in 2013.”
I agree! It’s almost like he is talking about the forex markets right now. The central banks are in crisis mode and their competitive, easy-money policies mean we’ll continue to see powerful currency movements as we have had recently. This currency crisis/opportunity will benefit short- and medium-term traders in particular.
As a swing and day trader, I analyze higher time frame charts to help guide me to opportunities in my preferred time frame. Based on the higher time frame charts, I’ll share three currency pairs where I believe “the music is going to play” in the coming weeks and months: USD/CHF, USD/JPY, and gold.
Gold (GLD), you might ask? Is gold really a currency? Yes, I believe so. It is an age-old currency that was replaced a couple hundred years ago by paper money that, indeed, allows for easier transactions. From a trading perspective, I find that gold prices and currency prices behave exactly the same and I apply my same forex trading systems to gold for very similar results.
After Its Big Move Up, Where is USD/JPY Heading?
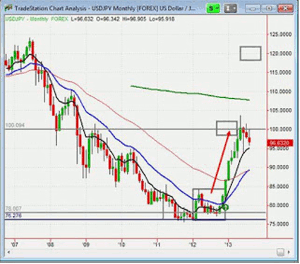
As a direct consequence of “Abenomics” (the popular label applied to Prime Minister Shinzo Abe’s aggressive monetary easing policy to boost Japan’s competitiveness) we saw a strong momentum move long USD (UUP) JPY (FXY), which lasted more than nine months in a row and offered multiple short- and medium-term trade opportunities. Here’s the monthly bar chart for USD/JPY:
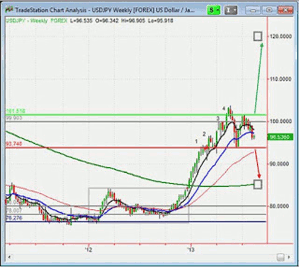
The main question now is: was that it or are we going to see even further upward momentum? Well, it depends. Let’s get into more detail by moving to the weekly bar chart below. Late last year, the yen devaluation took off and we saw four higher pushes up with the last push cutting through the big number of 100.00. The USD/JPY was obviously in a very strong trend, but then, experienced a rapid, relatively weak four-week pull-back where the eight-month moving average acted as first support (see black line in the monthly chart above).
With momentum this strong, it is not unusual for the trend to continue even further after a shallow pullback. Since it is more likely that a trend will continue rather than reverse, we should expect a continuation of the devaluation. At the moment, however, prices are in “no-man’s land” between the last lower high (green line) and the recent lower low (red line). To mitigate risk before considering a long position, a price move above first the big number 100.00, and then 101.52 would be necessary. Then, a continuation in length and strength of the prior move should be expected. A deeper pullback becomes more likely in the case that prices show further weakness and break below 93.74.
The potential target for the long move is 120.00 and 85.25 for the short move (see price target areas marked with small grey rectangles on the right in the chart).
NEXT PAGE: 2 More Upcoming Trading Opportunities
|pagebreak|What Happened to the Once Great Trading Pair USD/CHF?
The USD/CHF (FXF) was once my preferred candidate for short trades, but for about two years now, nothing much has happened on the short side. Where do we stand?
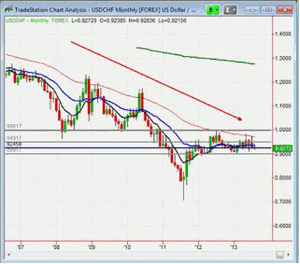
Overall, the pair is still in a clear down trend on a long-term basis (see the monthly chart below). In the strong, mid 2011 down-spike, prices overextended from the 8 & 21 period MAs (black & blue line). Prices needed some time to “rest” to allow the moving averages to “catch up.” The MAs have caught up now and one can clearly see that they are all nicely lined up in correct order (8<21<50<200)—a sign of a prevailing strong trend in the monthly chart below. The down trend is far from being over.
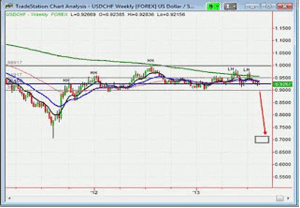
The weekly chart below provides in better detail a nice rounded pattern with once higher highs turning (for about two months) into lower highs. The prices were not strong enough to cross above the big number of 1.0000 and have formed lower highs since then.
I see this upward correction coming to an end soon. If USD/CHF breaks lower than 0.9000, it would provide confirmation for the resumption of the down trend. This could take a couple of weeks, but if it does, the prior strong down move would continue to an expected level below 0.7000 (marked with the gray box on the right of the chart). Multiple trade opportunities will offer themselves to traders who are prepared with good swing systems on the way down to 0.7000. That’s a distance of more than 2000 pips with barely any support levels in the way.
Gold—Where Do We Stand?
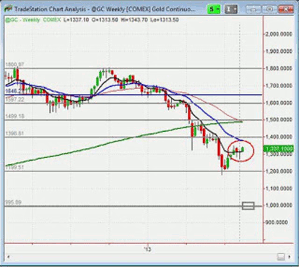
For about two years now, gold has been in an intermediate down trend from its 2011 high of 1950 USD. Gold’s high occurred after an unprecedented 12-year uptrend with relatively minor corrections. Since May of last year, gold increased its downward acceleration, breaking through the weekly 200MA, which had previously acted as strong support (see the weekly chart below).
You might ask: can gold go lower after all the money printing and chaos in the financial world in the last two years? A look at the market technicals help answer that question—of course. All of gold’s MAs line up in correct order pointing to a strong down trend. For five weeks now, prices have come back to just join the MAs—a very healthy development for a continuing downtrend. Is this enough of a pullback to resume the downtrend? Let’s have a look at the market dynamics of a lower time frame.
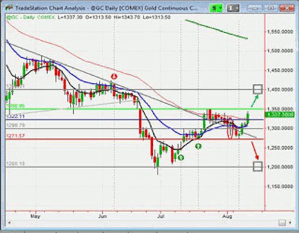
The daily chart above shows a nice green rejection candle on August 1 (red circle), which indicated a continuation of an intermediate long correction move. However, a test of this candle low has proven to hold (after having made a quick new low), which was followed by a decisive up move clearing prior resistance. Now again we have two lines: the break of the green line indicating further upward correction towards 1400 USD (within a still prevailing downtrend), or, the break of the red line pointing towards a resumption of the two-year downtrend towards 1200 USD and lower.
Trading the Current Forex Markets
Given the discussion, was it possible to make money swing trading in this recent turbulent environment? Yes—gold was my most profitable swing trading currency during the last two months with three very good trades. My system had me enter short first on a daily bar setup and then enter short twice on 4h bar setups. All three trades (see the chart above, red arrow for short entry, green arrows for long entries) were based on the busted breakout system.
By Michael Michaud of Invest2Success Blog

