For the trader just starting out in the realm of forex, there are three indicators that can make his technical analysis more reliable and accurate, says the staff at FXTimes.com. So, in this article, the staff highlights how to use moving averages, Bollinger bands, and parabolic SAR.
If you want to make your technical analysis more reliable and accurate, there are three indicators that can make a difference for you; those are moving averages, Bollinger bands, and parabolic SAR. Here in this article, you will learn how to use moving averages and Bollinger bands to generate reliable signals.
Moving Averages
Traders make use of moving averages in different ways; however, we will discuss only two most effective and easy ways to generate buy/sell signals with the help of moving averages.
Single Moving Average
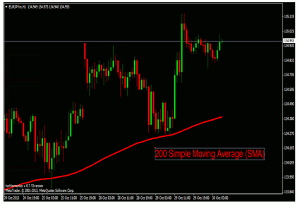
A single moving average divides the trading area into two zones that are bullish zone and bearish zone. For this purpose, 200 simple moving average (SMA) should be used. Every time when the price hits 200 SMA, it will most likely be bounced back.
In downtrend, 200 SMA acts as a critical support level, whereas, in upward trend the same moving average acts as critical resistance level. Traders tend to buy the pair on breakout through resistance and bounce back from the support level, while prefer selling on breakout through support level and bounce back from resistance.
Double Moving Average
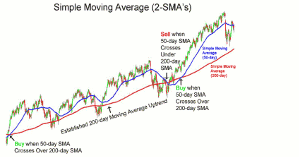
Traders make use of double moving average or two moving averages to find a crossover. For this purpose, usually a faster moving average (50 SMA) is used in conjunction with slower moving average (200 SMA).
A long position should be opened at a point when 50 SMA crosses and comes above 200 SMA. Conversely, a short position is preferred when 50 SMA crosses and comes below 200 SMA.
Bollinger Bands
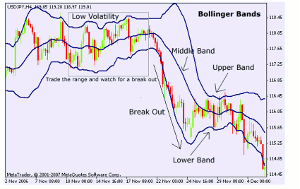
Bollinger bands consist of three bands, upper Bollinger band, middle Bollinger band, and lower Bollinger band. Middle Bollinger band is nothing but a 20 SMA, upper and lower Bollinger bands are of main significance.
A bullish reversal is expected every time when price hits lower Bollinger band, whereas a bearish reversal is expected when the price touches upper Bollinger band.
In addition to potential reversal, Bollinger bands also show the level of volatility in the market. Market is less volatile when Bollinger bands are squeezed and vice versa.
It is pertinent that one should not rely solely on Bollinger bands for decision making, technical indicators are always effective when they are used in combination with other tools, particularly trend lines.
Parabolic SAR
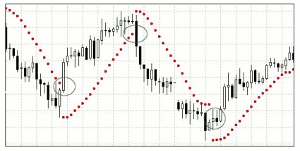
SAR refers to “Stop and Reverse.” It is another one of the famous technical indicators that predict possible reversal in price pattern. Traders tend to open buy position when Parabola SAR dots are below the price line, whereas selling is preferred when SAR dots are above the price line.
In the end, it must be noted that all the technical indicators work fine when the market is trendy, they all fail to produce reliable signals in a range bound market. Similarly, market fundamentals must also be looked at closely because fundamentals are far more superior to technicals, that is the basic rule. This was a short summary of a few very useful technical indicators, hopefully it would work.
By the Staff of FXTimes.com


