
The moving average convergence/divergence (MACD) can be used as an oscillator to monitor short-term momentum or as a tool to spot trends. Most charting packages that offer the MACD usually have the default settings of 12-26-9. To calculate the MACD of a stock or index, simply subtract the closing price’s 26-period exponential moving average (EMA) from its 12-period EMA.
The MACD formula is expressed like this:
MACD= EMA (12) - EMA (26)
A nine-day EMA is plotted with the MACD, which acts as a signal line.
The creator of the MACD, Gerald Appel, recommends using the settings of 8-17-9 to enter a position on the daily chart, but suggests a different combination (12-25-9) for selling opportunities.
Veteran trader Martin Pring, in his classic book Technical Analysis Explained, advises traders to use the custom settings of the 65-period EMA and 90-period EMA with a 12-minute period as the signal line (65-90-12) in order to gain a better performance from the MACD in the 60-minute time frame. Pring testifies that these MACD parameters will help maximize profits and help minimize whipsaws and overtrading. Interestingly enough, Pring feels that the traditional settings are better suited solely for the monthly time frame.
Let’s look at an example of Pring’s MACD parameters in action.
The accompanying hourly chart of Direxion Daily Emerging Markets Bear 3x Shares (EDZ) generated several buy and sell signals in the early part of 2010 using the Pring methodology. Pring’s MACD settings provided a timely long entry shortly after the mid-January bottom. The upper panel of the chart shows that this entry point coincided with prices jumping above the 50-period exponential moving average (EMA).
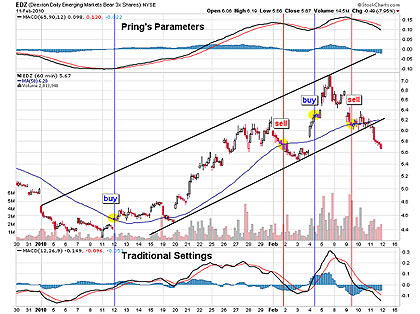
Click to Enlarge
Ironically, the MACD flashed a sell signal as prices simultaneously dropped back below the 50-period EMA in early February. This trade would have triggered a long position around $4.57, followed by a sell signal that was triggered near $5.71, resulting in a gain of approximately 25% in about the span of three weeks (see the entry/exit points highlighted in yellow).
The lower panel on the chart showcases the MACD with it traditional settings of 12-26-9. Using the classic settings would have allowed a trader to enter a long position a little earlier—prior to the gap above the 50-period EMA—but would have produced several false sell signals during the advance. Pring’s settings helped smooth out the MACD, thus avoiding the pitfalls and trappings of numerous false sell signals.
The next long signal was generated after prices had already gapped up coming off the February bottom. This offered a bit of a belated entry point as prices launched a moon shot to complete the upper trend line of the rising price channel. And even worse, the sell signal was triggered just a few days later, after prices had already taken a nosedive, giving back all of the gains that had previously been made.
And unlike our previous example, this trade would have suffered some short-term losses. Strict adherence to Pring’s parameters would have caused a trader to miss out on what would have been solid gains had the position been sold using the MACD’s default settings.
During this second trade, the Pring methodology would have signaled a long entry point around $6.30 and generated a sell signal around $6.15 (see the entry/exit points highlighted in yellow). Alternatively, the classic MACD settings would have offered a much more timely exit. However, despite the bad timing of this particular trade, and that it generated a slight loss, the fact of the matter is that the sell signal still managed to leave the trader unscathed. What‘s more is that the system flashed a sell signal prior to the breaking of the lower channel line, protecting the trader from further downside risk.
In conclusion, the first trade generated excellent profits and offered a timely entry and exit, while the second trade (made at more extended levels) provided more awkward, clumsy entry and exit points. And I think the reason why the second trade didn’t pan out was largely due to the positioning of the MACD itself. The bullish MACD signal that was triggered in the early stages of the trend occurred when prices were in the infancy stages of the trend. The MACD reveals that prices were deeply oversold at that time.
But the second buy signal was given after the trend was mature, giving the trader a much more bumpy roller coaster ride. The trader would have been better served to be more selective by first allowing the indicator to lose some altitude and reset when prices become overextended. That would have put a trader in a much better position to exploit this ETF at a later date.
A savvy trader should have several worthwhile tools in his/her arsenal that compliment and confirm each other. And I think Martin Pring’s MACD parameters are worthy of being a part of our technical toolkits, because when put to the test, Pring’s parameters produce profits.
By Ron Walker of TheChartPatternTrader.com


