
Ever-popular Apple (AAPL) stock now faces a key, “make or break” confluence level on both the daily and weekly chart that traders will find very interesting.
Let’s start with the weekly chart and drill down to find the important confluence level, and thus, the “if/then” trading set-ups that are likely to come into play.
Watch a video about rating your trade set-ups here.
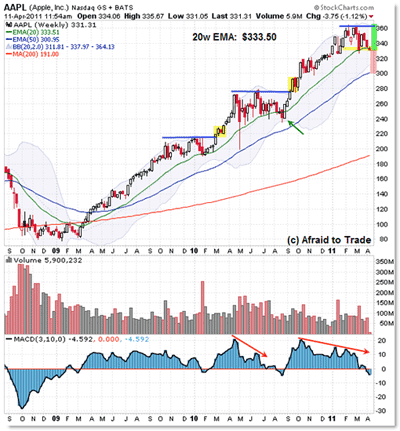
Click to Enlarge
Cutting right to the point, the key weekly level right now is the rising 20-week exponential moving average (EMA) poised at $333.50. (Read more about trading with moving averages here.)
You can see from the chart that the rising 20-week EMA has marked the bottom or end of the retracement swings down in the context of the powerful rising price trend. It’s possible the current test of the 20 EMA will hold support this time as well.
If not, then the next lower level to expect support will be the confluence at $300, thus setting up a bearish scalp to test $300 if we see a sudden breakdown soon under $330.
That’s easy enough. So the weekly “if/then” becomes:
“If the 20-week EMA holds as support at the $330 level, then expect a rally up to $360 to see if buyers can test or break through the high.”
Or, “If sellers push price under the 20-week EMA at $330, then expect a selloff to find support at the $300 level.”
The daily chart gives a better picture of these statements:
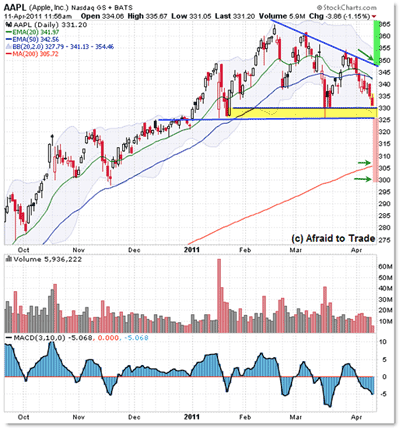
Click to Enlarge
Again, going for the simple observations, the daily chart shows us the floor of support between $325 and $330 as shown.
In a stock as volatile as Apple, it’s best to think of support and resistance as floors rather than perfect price points that trigger an automatic shift in position if broken.
Anyway, the daily chart shows a potential descending triangle (which is not necessarily bearish) with boundaries at $325/$330 and then a falling upper trend line in the $350 region.
That allows us to modify our weekly “if/then” logic to the following:
“If above $330, then the chart is bullish and a breakout above the falling trend line at $350 is further confirmation of the bullish picture and bounce off support, which will likely lead to a retest of $365 or perhaps a continuation of the breakout.”
That’s using a lot of words to say that “We’re in the bullish camp expecting breakouts and trend continuation as long as we’re above $330.”
And of course, “If sellers break down through the confluence support at $330, we’re likely to see $300 again, which happens to be the rising 200-day simple moving average (SMA).”
I like to draw green highlights above triggers to upside targets and of course red highlights under support triggers to lower targets; it helps simplify the chart.
For those of you who love Fibonacci analysis, going a little bit beyond basic charting as above, we have an interesting Fibonacci short-term confluence that just happens to converge at $331:
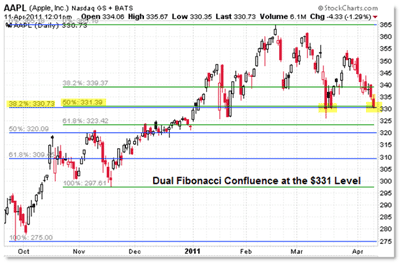
Click to Enlarge
Without going into too much detail, I drew two small Fibonacci retracement grids from the $275 swing low (blue) and the $297 level (green) as shown—both to the $363 pivot high in February.
What’s most important—and should leap off the chart at you—is the dual confluence band at $331 (the 38.2% Fibonacci level represented by the blue line and 50% Fibonacci level represented by the green line).
It just means traders seem to be respecting the $330 level, which forms a confluence with prior price levels, Fibonacci levels, and the 20-week EMA. (Read more about how I trade with confluence of price levels here.)
Thus, it’s a level you should be watching very closely. It would be profoundly significant if sellers busted under the confluence levels, thus opening the door for a fall to $300.
Anything except a firm fall under $330 and we would expect the rising uptrend to continue.
By Corey Rosenbloom, trader and blogger, AfraidToTrade.com


