
The staff at Investopedia.com explains how to use the key figures given in federal crop reports to determine trends in the agriculture market.
Crop production reports, issued by the United States Department of Agriculture (USDA) every month, are often considered the most important weapon in a fundamental trader's arsenal. These reports release new information regarding supply and demand of US grains and oilseeds, and are a must-read for anyone who trades in the corn, soybean, or wheat markets.
These reports have the potential to change the outlook of the markets drastically: a slight change from the previous month in any of the report's numbers can have major price implications. Even a one-bushel increase or decline in potential yield might have a huge impact.
The reports, however, are virtually useless to the trader who does not know how to properly analyze and interpret them. In this article, we'll show you how to get the most out of these USDA reports.
The Concept of Carryout
The most important number that the USDA issues on its monthly Crop Production reports is the carryout estimate. Carryout (also referred to as "ending stocks") is the amount of grain left over after all demand has been satisfied. In essence, carryout equals supply minus demand.
A low carryout will generally lead to high prices, while a high carryout will lead to low prices. Several different factors affect the carryout estimates issued by the USDA, as supply and demand are themselves influenced by various factors.
The following paragraphs will demonstrate how carryout is calculated, and how the numbers that the carryout estimate is based on can predict the market's reaction to the USDA report.
Calculating Supply
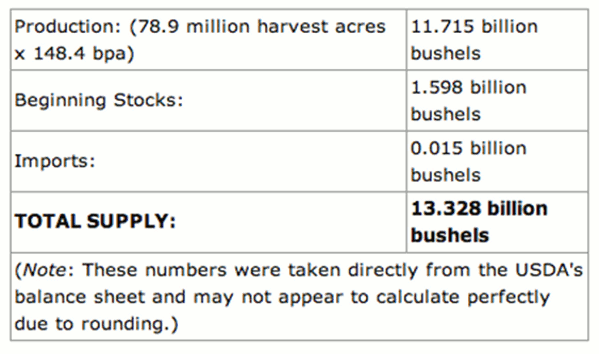
First, we'll discuss supply. As far as USDA balance sheets are concerned, supply will equal acres times yield plus beginning stocks (last year's carryout) plus imports.
For example, on a previous year’s report on supply-demand balance sheet for corn, the USDA projected the total supply to be 13.328 billion bushels. The USDA calculated this total using 78.9 million harvest acres multiplied by 148.4 bushels per acre (bpa) yield for a final production number of 11.715 billion bushels. This number was added to the beginning stocks number of 1.598 billion bushels and to the import number of 0.015 billion bushels.
Written as a formula, the numbers look something like this:
Click to Enlarge
Next: Calculating Demand
|pagebreak|Calculating Demand
The demand side of the balance sheet is slightly more complicated, but still relatively simple to understand. Demand for grains and oilseeds produced in the US is spread among several different types of end users. In recent years, for example, biofuel producers have used a huge amount of grain for ethanol and biodiesel production.
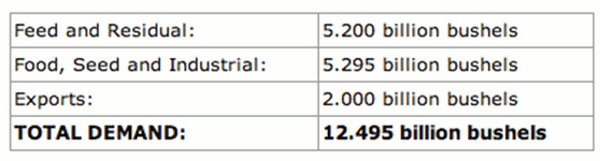
We'll continue using corn as our example in putting together our balance sheet. About one-third of all corn grown in the US is used to produce ethanol, and about 40% is used for livestock feed. Smaller amounts are exported to other countries or used for food, seed, and industrial use.
Looking a previous year’s USDA's supply-demand balance sheet for corn, the USDA estimated total use for corn at 12.495 billion bushels. This number was put together using 5.200 billion bushels for feed, 5.295 billion bushels for food, seed, and industrial use (which includes 3.95 billion bushels for ethanol) and 2.000 billion bushels for exports.
The demand side of the balance sheet adds up as follows:
Click to Enlarge
Calculating Carryout
Now, using our total supply and total demand numbers, we can calculate the projected carryout:
Total Supply - Total Demand = Carryout
13.328 - 12.495 = 0.833 billion bushels (or 833 million bushels)
Once a new carryout number is known, traders must first analyze the entire balance sheet and then decide for themselves what impact this new information will have on the market.
Generally, a trader will be able to find pre-report estimates put together by groups of analysts. These estimates are what the market is anticipating from the reports. Pre-report estimates can be found on any news wire service.
Grain traders generally look for one of three scenarios when looking at fresh information from the USDA: based on the report and information previously known, they try to classify the market as either bullish, bearish, or neutral. Once this classification is made, traders position themselves in the market accordingly.
The Bottom Line
Knowing carryout numbers and their relationships to the carryout numbers of past years is one of the cornerstones of fundamental analysis when trading in the grain markets.
A good fundamental trader should be able to predict the impact of a new USDA report simply by examining the carryout number and how it was calculated. As a rule, carryout is generally one of the best indicators of a yearly price range for a given agricultural commodity. Balance sheets for wheat and soybeans are extremely similar and should be easy to follow after reading this article.
This article was written by the staff at Investopedia.com.


