
Richard Cox of TradersLaboratory details how traders can identify whether a trend is reversing or ready to resume, in order to capitalize on the market's momentum.
The key questions for any trend-based trade centers around the assessment of its cyclical position:
- Is an old trend ending?
- Is a new trend beginning?
- Is the trend in need of a correction (an oppositional move toward
historical averages)?
- Is the previously established trend ready to resume after a correction has
completed?
Inaccurate answers to these questions will result in losing positions. This means you will buy into an uptrend that is ready to reverse, sell a downtrend just before it begins making an upside correction, etc. There are many potential scenarios that could result in losing positions.
So the real work when basing your decisions on trends comes from your work in determining which stage the trend has reached in its overall life cycle. This is obviously a broad topic, so the scope of this article will focus on one potential scenario, asking the question: Is the previous trend ready to resume? When an established trend is ready to resume, high probability positions can be taken and it becomes possible to capitalize on the underlying momentum that is present in the market. Here are three types of market events to watch.
Understanding Corrections
Uptrending Chart With Corrections
Click to Enlarge
First, we must have an understanding of what a market correction looks like. This is the scenario that will need to complete before the trend can resume. In the first chart example above, we can see a series of relatively minor downside corrections within a broader uptrend (shown as red arrows). "Market corrections are essential, because no asset can rise or fall indefinitely," said Sam Kikla, markets analyst at BestCredit. "The market needs an opportunity to "take a breath" and return to its historical averages in order to generate fresh momentum for prices to continue further." These corrections allow traders to re-enter the market and establish new positions. These new positions are what enable valuations to continue higher or lower.
Fibonacci Levels Validated
The first chart example shows price corrections that are relatively random in nature. They are all of varying degree and follow no predictable sequence. Of course, there is nothing wrong with this, and this is the way most corrections will unfold as you are watching the trend. But when we add Fibonacci retracements to the equation, we can start to quantify the price lengths that will mark the smaller correction within the larger trend. I will not go into the intricacies of Fibonacci but I have written about some of these previously. The most commonly watched areas when Fibonacci zones are plotted can be found at the 38.2%, 50%, and 61.8% retracements of the larger move.Downtrending Chart With Fibonacci Retracement Resistance
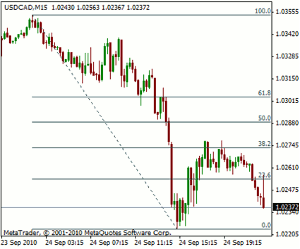
Click to Enlarge
These levels are used to plot potential points of support (for uptrends) and resistance (for downtrends). In the chart example above, we can see the 38.2% Fibonacci level act as resistance in a broader downtrend. If this level did not hold, it would be a short-term indication that the downtrend could be over-and traders would then begin to target larger corrections back into the 50% and 61.8% Fib levels (at least). In the example below, the 38.2% retracement does hold, and this then places the focus back on the previous lows that marked the measured move in the downside Fibonacci wave. Aggressive traders could have entered into short positions once prices started to fail at the 38.2% retracement. More conservative traders might want to wait until the longer-term support level to break before committing to a position. In both cases, we have signals that the longer-term trend is resuming.
NEXT PAGE: Consolidation Breakouts
|pagebreak|Consolidation Breakouts: Triangles and Ranges
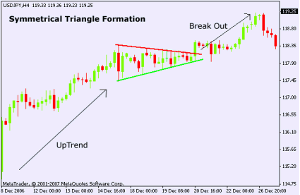
Consolidation breakouts in the direction of the previous trend mark the second way of determining whether or not the previous trend is in place. Consolidation points are essentially periods of indecision in the market. There is not enough available information for the majority of traders to be swayed in one direction or another. But these periods cannot last forever. When consolidation patterns eventually do break, the break tends to be forceful and decisive. The market has likely received the information it wanted and now prices are ready to make a strong move. When this happens in the direction of the original trend, the signal is more valid as it is supported by the already established momentum of the prior trend.Triangle Consolidation Chart
Click to Enlarge
In the example above, we can see that an uptrend has established itself with a strong series of higher highs. This is followed by a period of sideways consolidation that is marked by a decreasing range of constricting support and resistance levels. This gives us the triangle formation that will be important in determining whether or not the original uptrend will be able to continue. In this example, the breakout is to the upside, and this would be an indication that long positions can still be taken as a way of capitalizing on the broader trend.
Range Breakout Chart
Click to Enlarge
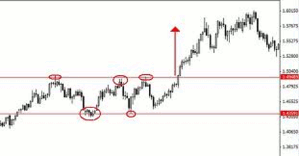
Next, we look at range-bound conditions, where the support and resistance levels are not constricting and sideways trading dominates. Breakouts from these patterns tend to be less forceful. This is because a greater tightening of market energy is required to form a triangle but these are important patterns to watch nonetheless. The chart above shows another bullish scenario, where prices enter the range from the bottom (in an uptrend). Prices test both sides of the range multiple times before breaking to the upside. This confirms that the original bullish trend is still in place and that long positions can still be established.
Elliott Wave Completions
For those unfamiliar with the basics of Elliott Wave patterns, I have written previously about the main structures. For the purposes of this article, we are mostly concerned about the corrective A-B-C periods, as these points mark the levels where the trend will either resume or begin to fail. A-B-C patterns do not require prices to be trading within a constrictive range, so this allows traders to spot new instances of trend resumption when a Triangle or sideways range is not present.ABC Elliott Wave Chart
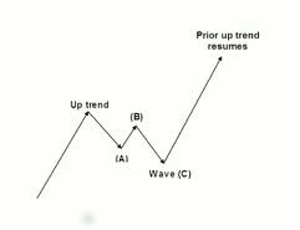
Click to Enlarge
In a bullish scenario, we would want to see a structure similar to what is pictured above. Prices begin to correct to the downside after an uptrend, hitting point A before rising to a lower high at point B. Prices then fall below point A to carve out new support zones at point C. This is the critical area, however, as we will need to see prices turn upward here in order to confirm that the broader uptrend is still in place. If this does not occur, avoid new long entries. If prices break above the B point, the correction has ended and the uptrend should resume. Conservative traders might wish to wait before the highest high is broken in order to confirm long position entries. More aggressive traders will enter after the B point is broken, as this signals the downside move was only a short-term correction. Here, the conservative trader would receive more confirmation before entering the trade. The aggressive trader would be able to capitalize on a better (lower) price level.
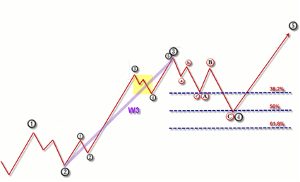
Elliott Wave With Fibonacci Retracement Chart
Click to Enlarge
As with any strategy, these ideas can be combined and in the chart above we can see an example of prices hitting the C point in a corrective Elliott wave move just as prices have also completed a 50% retracement of the original uptrend. A bounce out a zone like this creates a highly bullish scenario as you are receiving multiple signals that are all in agreement. So, while most of the examples above are bullish, the same rules apply when downtrends are seen (just in reverse). In all of these cases, traders can use the market's information as a way of assessing whether or not the broader trend has completed. These events can form the basis of a new bias for trade positioning.
By Richard Cox of TradersLaboratory


